
Interpretation and depiction images, and more!
|
Some plots showing various interpretations or depictions of Earth's interior (return to image directory page)
|
||||
 |
 |
 |
 |
 |
| AI (315 Kb) JPG (213 Kb) | AI (9.5 Mb) JPG (344 Kb) | AI (369 Kb) JPG (323 Kb) | AI (14 Mb) JPG (481 Kb) | AI (15 Mb) JPG (429 Kb) |
|
Downwelling material associated with subduction, as well as upwelling plume material, are underlain by lowermost mantle structure characterized by strong heterogeneity, anisotropy, and seismic wave scattering. [PDF]
|
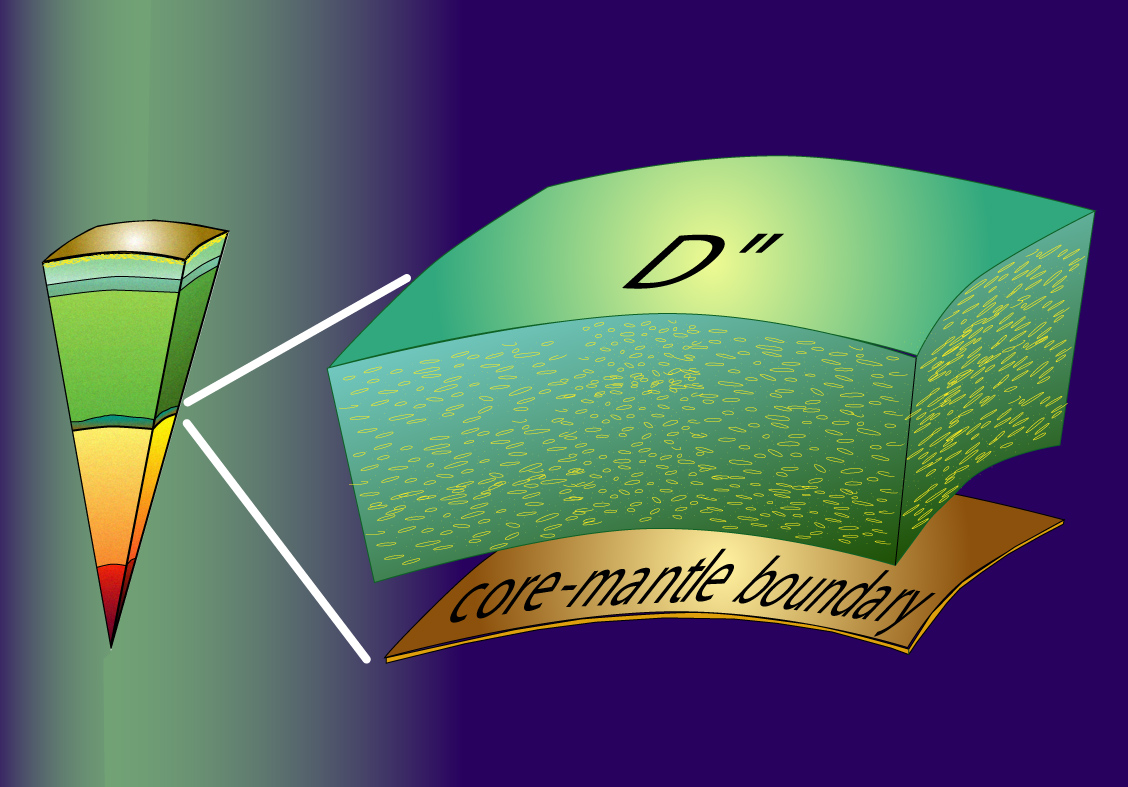
D" ("dee-double-prime") is the anomalous lowermost 200-300 km of Earth's mantle, and is home to the largest heterogeneities within the planet below the upper mantle. Here it is overly simplified as a spherical shell.
|
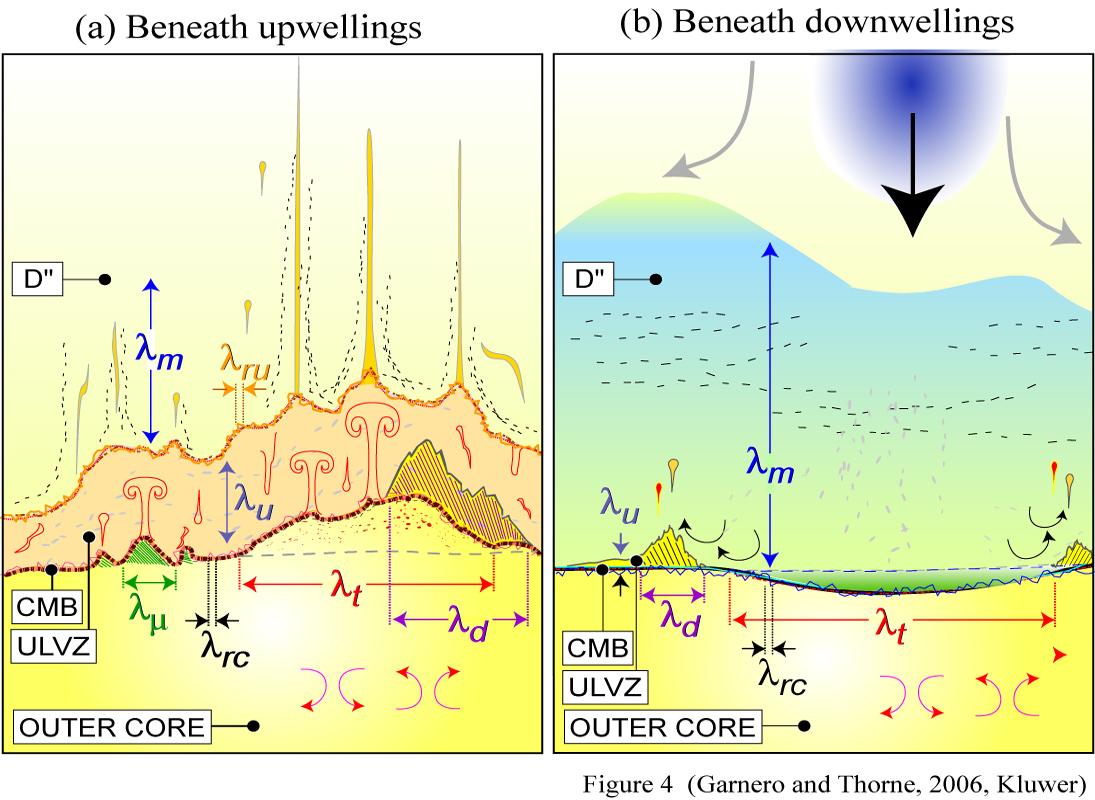
A multitude of scale lengths of dynamical processes and resulting structure may occur at the CMB. Here, possibilities beneath slabs and plumes are contrasted. I know, it's a very busy figure, perhaps this 4 Mb PowerPoint file helps.
|
This is a bit goofy: I wrapped an image of gallium crystals onto the CMB. You might have seen these in COMPRES literature. Of interest is an EOS article by R. Liebermann on the future of high pressure research.
|
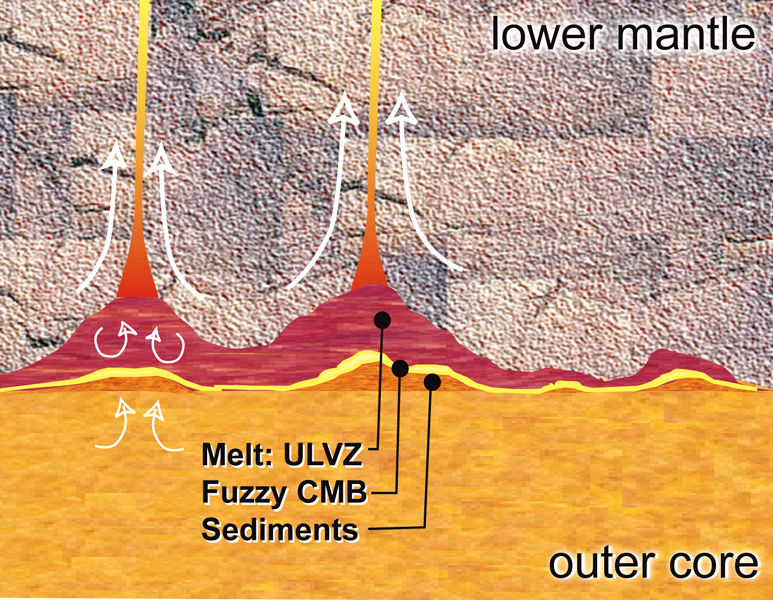
Fine layer at Earth's core-mantle boundary can exist as partially molten material, giving rise to ultra-low velocity zones (ULVZ). Blurring of the CMB, as well as under-plating of the CMB are also possible.
|
|
Some plots showing various interpretations or depictions of Earth's interior (return to image directory page)
|
||||
 |
 |
 |
 |
 |
| AI (251 Kb) JPG (163 Kb) | AI (9.3 Mb) JPG (172 Kb) | AI (595 Kb) JPG (229 Kb) | AI (310 Kb) JPG (163 Kb) | AI (220 Kb) JPG (168 Kb) |
|
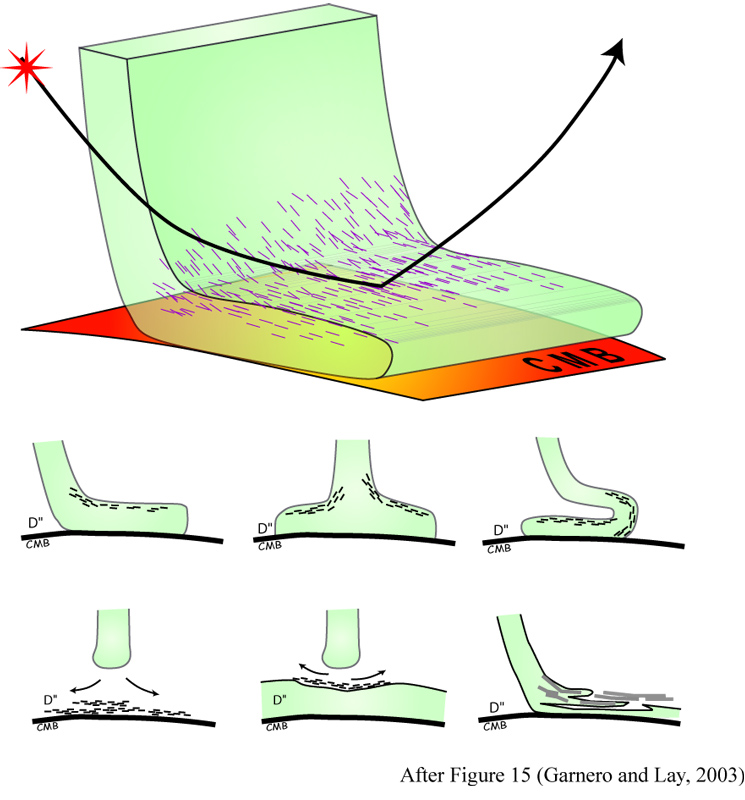
The figure speculates on possible ways to produce both a reflector off of the top of D" (thus precursors to ScS), as well as anisotropy (depicted by short stiples) within D". [PDF]
|
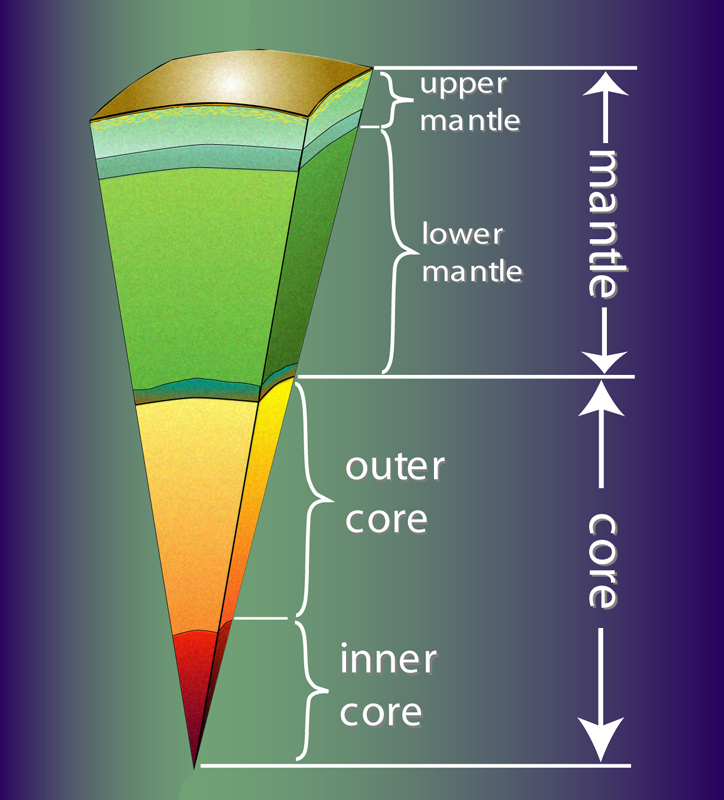
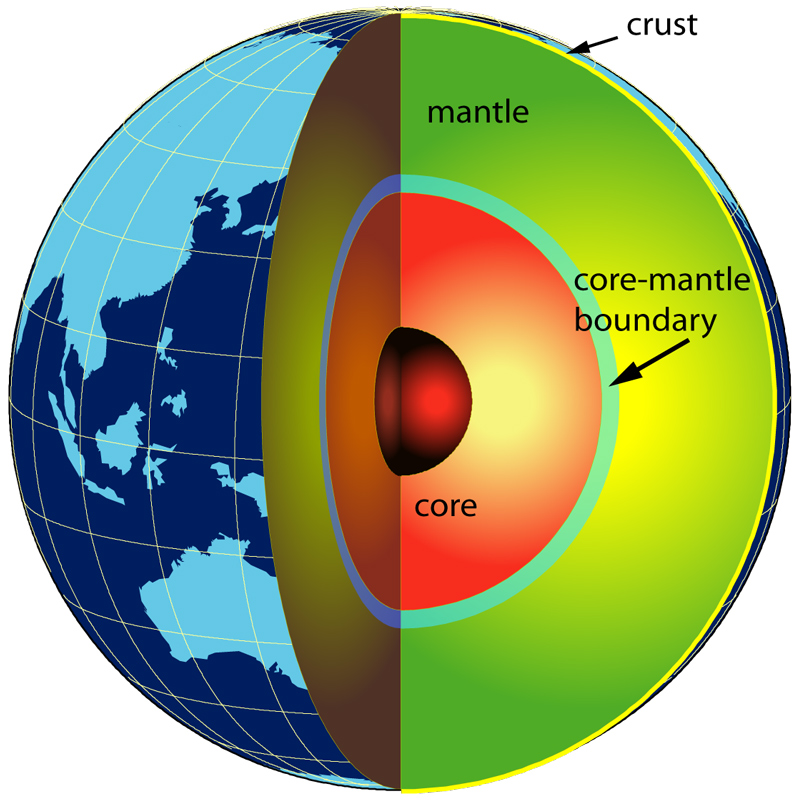
The simple figure depicts the main divisons within the Earth's interior. Here, shells only vary in the radial direction. But in fact, recent seismological analyses show that strong variations exist laterally.
|
In this image, we exploit the possibility that plumes originating in the deep mantle may originate near the edges of the low velocity structures (red). Thorne et al [2004] shows this is at least statistically true for the Earth.
|
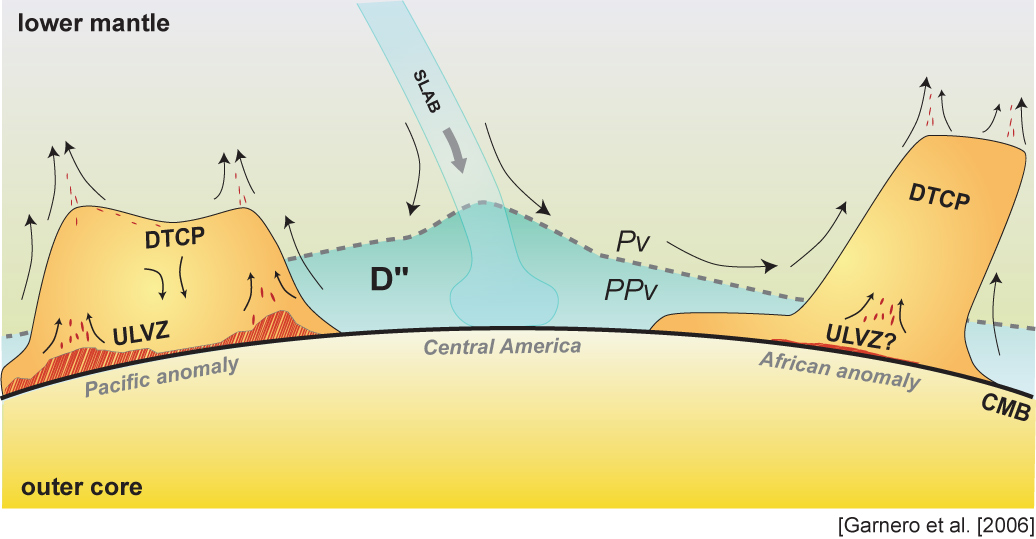
One of those 'kitchen sink' figures, attempting to tie together several observables (DTCP=dense thermochemical piles; Pv=perovskite; PPv=post-perovskite; ULVZ=ultra-low velocity zone; CMB=core-mantle boundary).
|
The transition zone (the mantle between the 410 and 660 km discontinuities) is probed using precusors to SS waves. Its thickness is studied as a possible approach in distiguishing between upper vs. whole mantle plumes.
|
|
Some plots showing various interpretations or depictions of Earth's interior (return to image directory page)
|
||||
 |
 |
 |
 |
 |
| AI (231 Kb) JPG (220 Kb) | PSD (16.1 Mb) JPG (203 Kb) | JPG (229 Kb) | AI (2.7 Mb) JPG (229 Kb) | AI (368 Kb) JPG (266 Kb) |
|
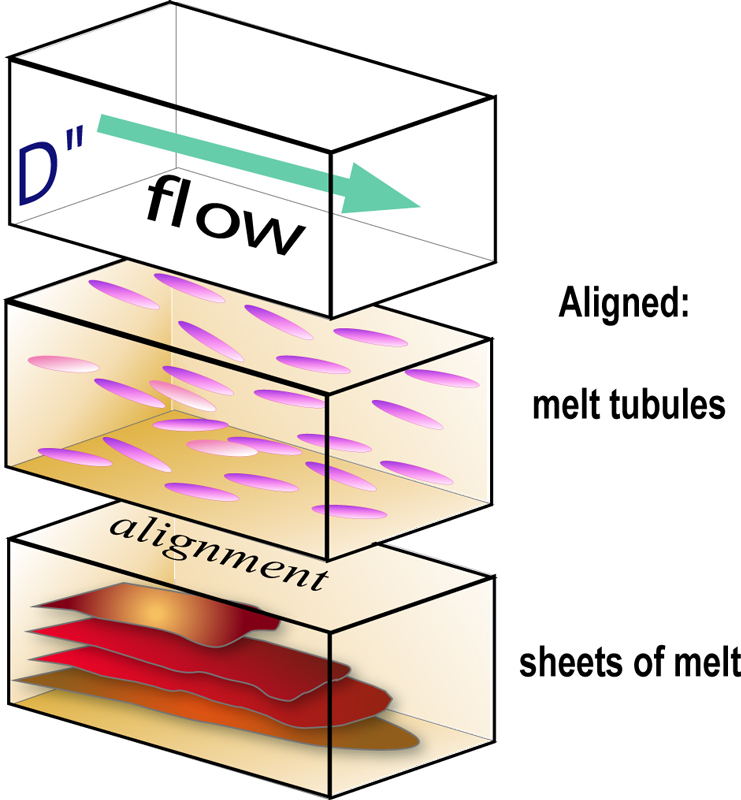
"Shape Preferred Orientation", or SPO, can cause shear wave splitting in seismic waves, in the the SV and SH waves respond to the heterogeneity differently. SPO can be invoked by strong boundary layer flow.
|
This figure is intended to highlight a variety of complexities that can occur in D", including a shear wave velocity discontinuity (blue), a deeper discontinuity (tan), and possible blebs of melt. This is more fantasy than anything.
|
I somehow lost the AI file for this one. Anyway, this is meant to emphasize that beneath active subduction, strong pressure forces might induce lattice preferred orientation (LPO) in the deep mantle D" layer.
|
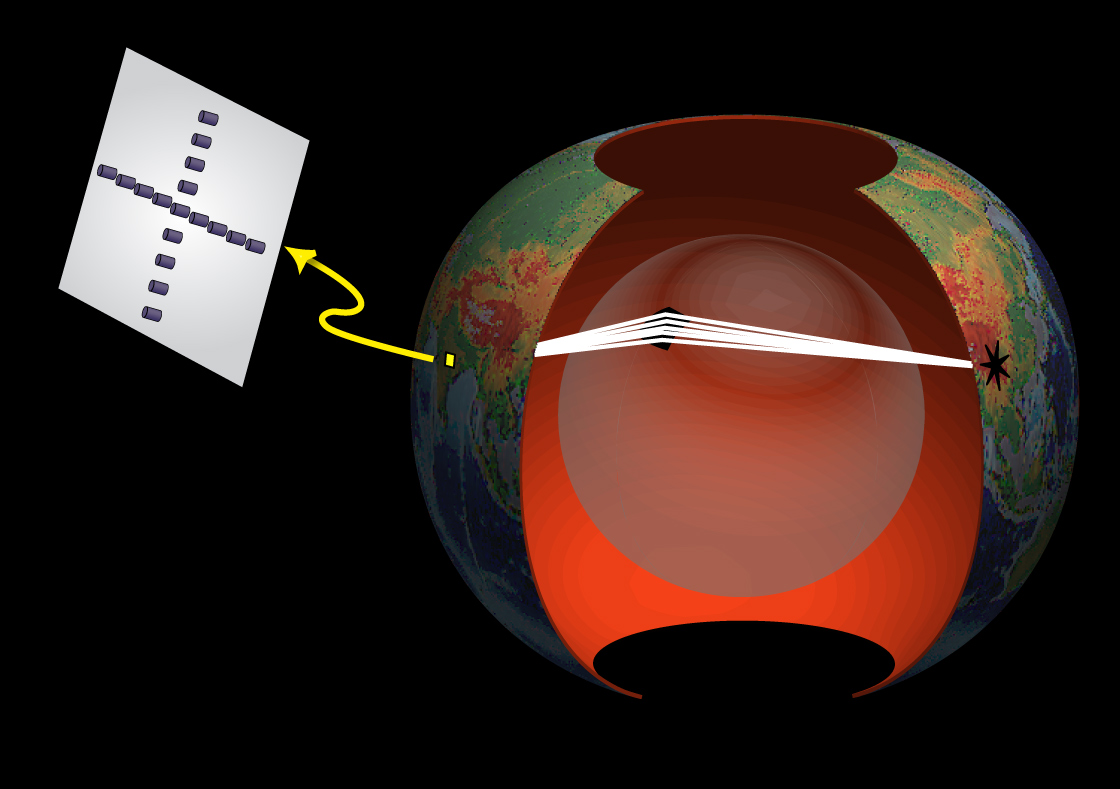
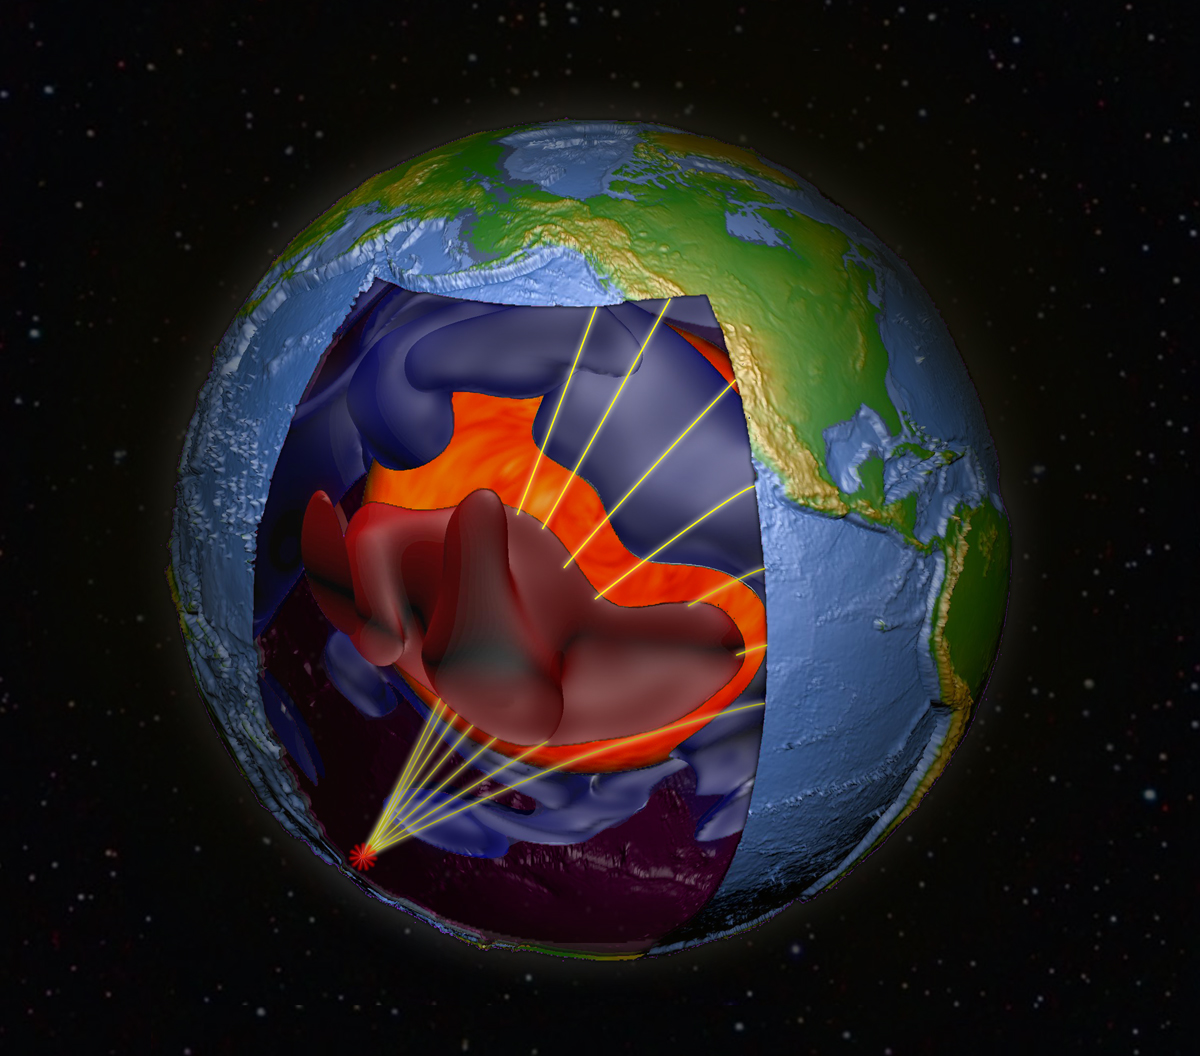
This figure is meant to motivate how seismic arrays can be "focused" to study a specific spot inside the planet. Here's a PowerPoint file that may be useful to general audiences.
|
Here's a really basic Earth interior image with the fundamental internal layering.
|
|
Some plots showing various interpretations or depictions of Earth's interior (return to image directory page)
|
||||
 |
 |
 |
 |
 |
| AI (2.0 Mb) JPG (287 Kb) | AI (1.3 Mb) JPG (491 Kb) | AI (4.0 Mb) JPG (313 Kb) | AI (876 Kb) JPG (188 Kb) | AI (195 Kb) JPG (207 Kb) |
|
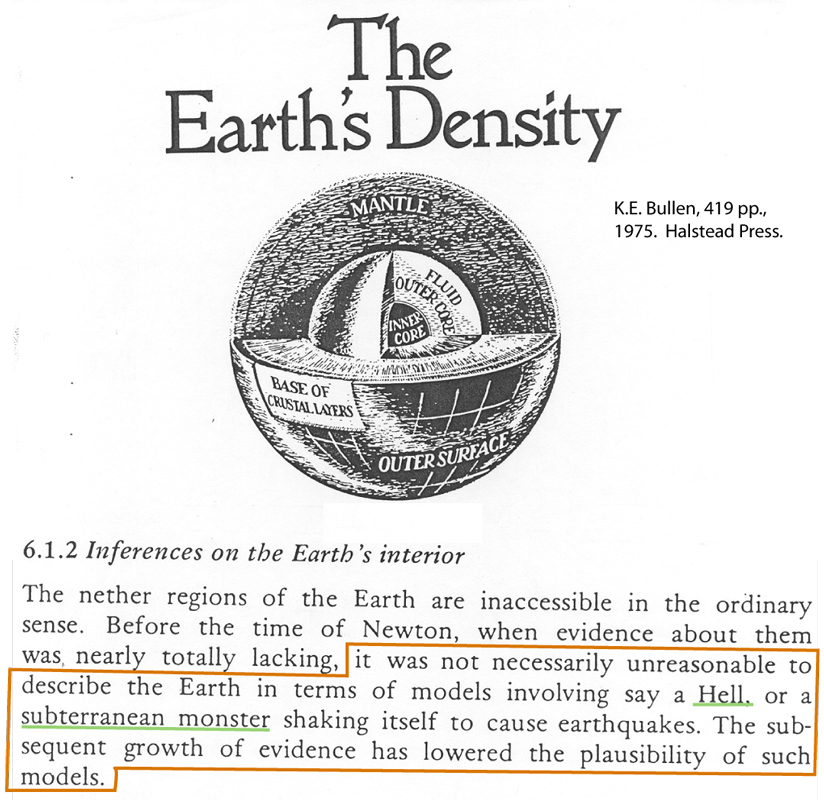
I love this quote by Sir Harold Jeffries, from his book on Earth's Density. It emphasizes that everything we know is still not fact. Check it out!
|
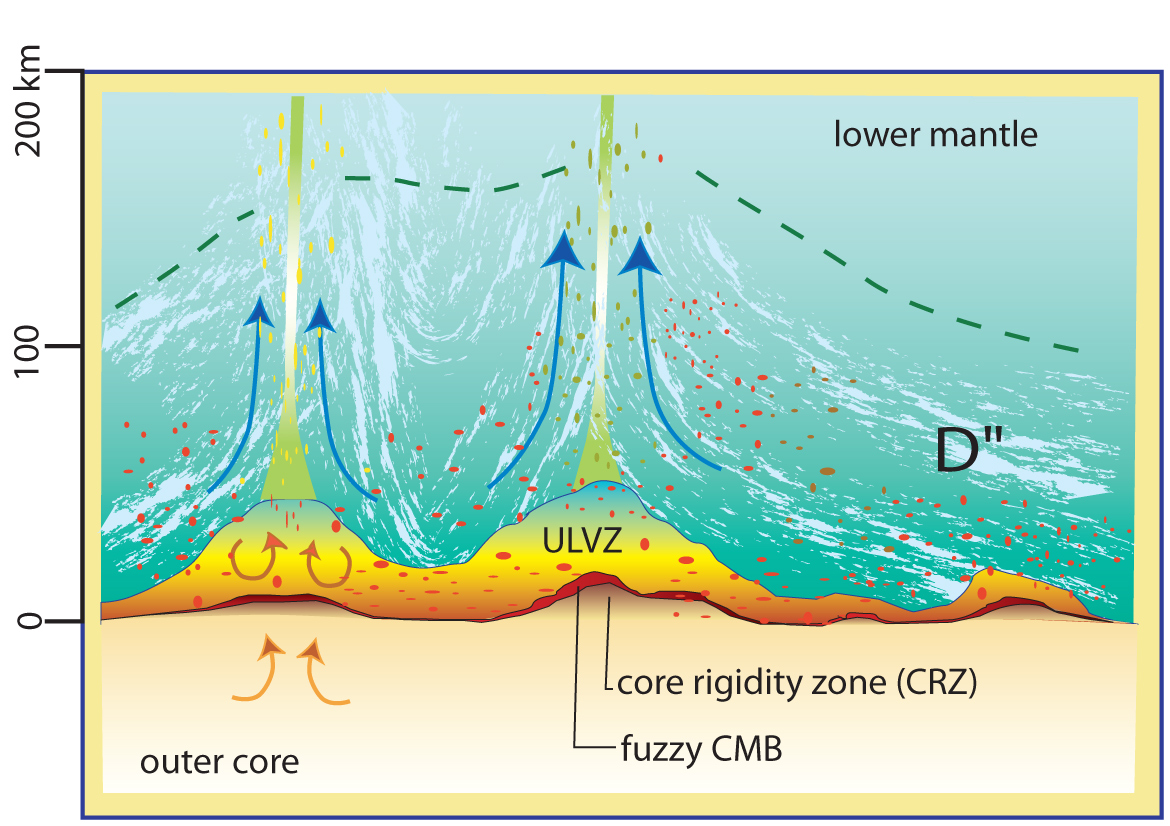
The core-mantle boundary may be exceedingly complex. This image is meant to emphasize this in the bottom 200 km of the mantle [PDF]
|
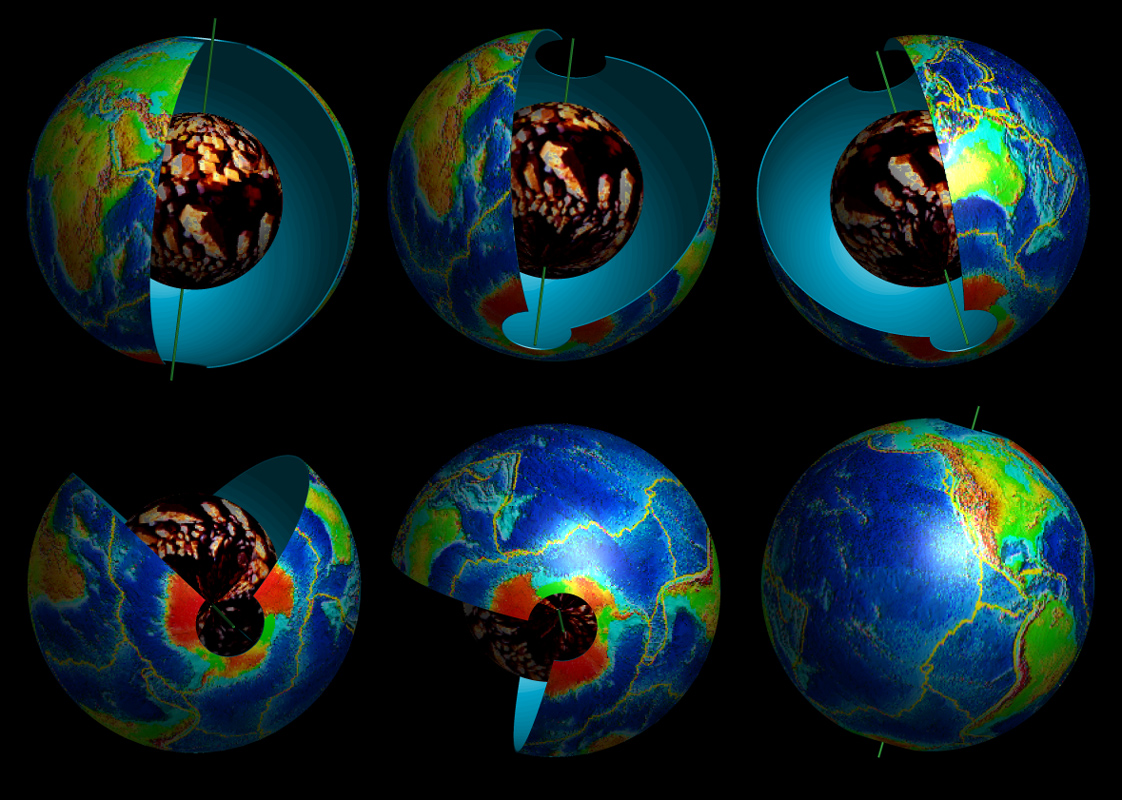
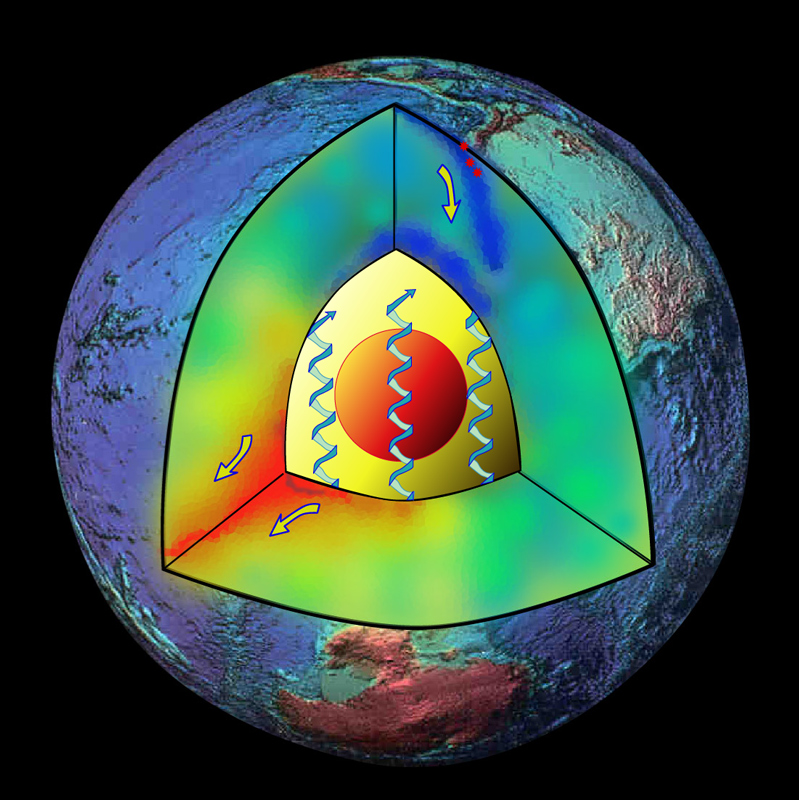
Down and upwelling material flow in the mantle is depicted by blue and red, respectively. The inner core is the red ball in the middle, and coil-arrows in the outer core depict fluid core flow.
|
Beneath the Cocos Plate, just west of Central America, the base of the mantle is imaged as having an offset in the D" reflectance. We interpreted this as a folded buckled ancient slab. [PDF]
|
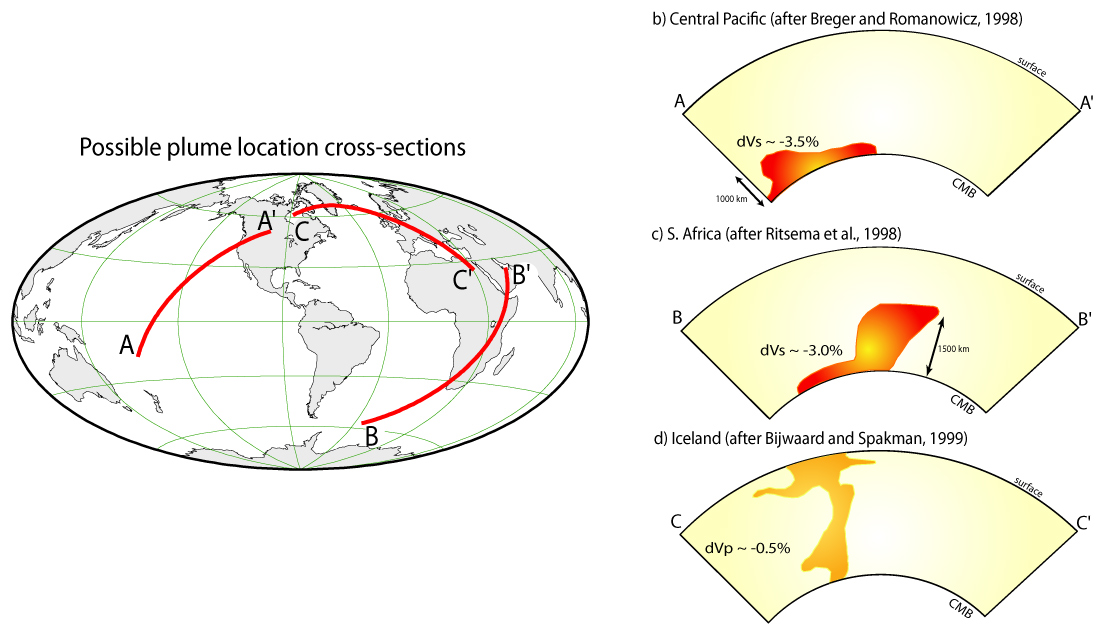
This figure is a tad old, but I still see folks using it, so I'll leave it posted. I depicts lowered shear wave speeds in a few studies that might relate to plumes or upwellings.
|
|
Some plots showing various interpretations or depictions of Earth's interior (return to image directory page)
|
||||
 |
 |
 |
 |
 |
| AI (2.8 Mb) JPG (362 Kb) | AI (3.9 Mb) JPG (388 Kb) | AI (398 Kb) JPG (452 Kb) | PSD (18.6 Mb) JPG (1.2 Mb) | PSD (14.5 Mb) JPG (119 Kb) |
|
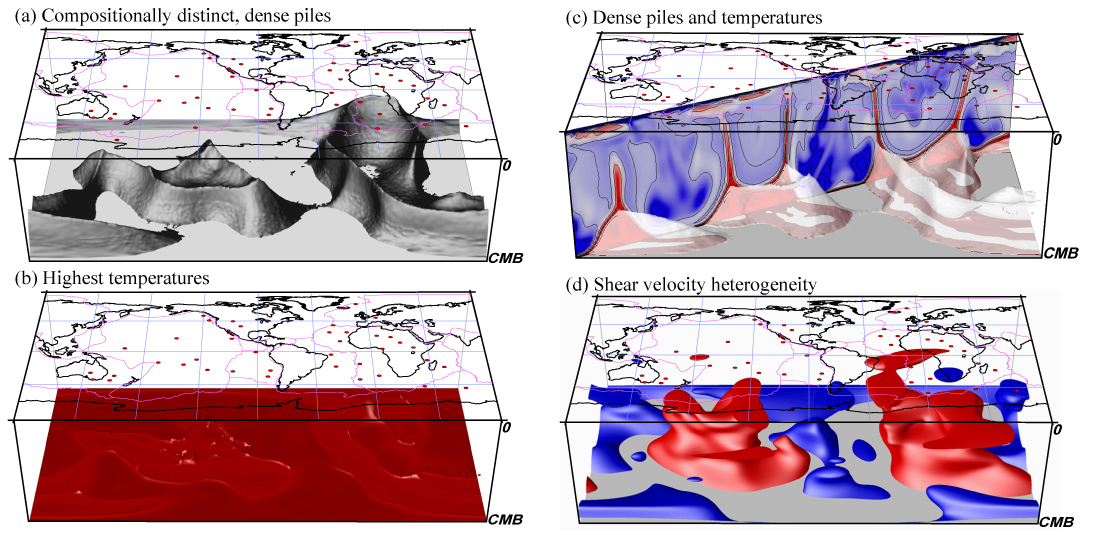
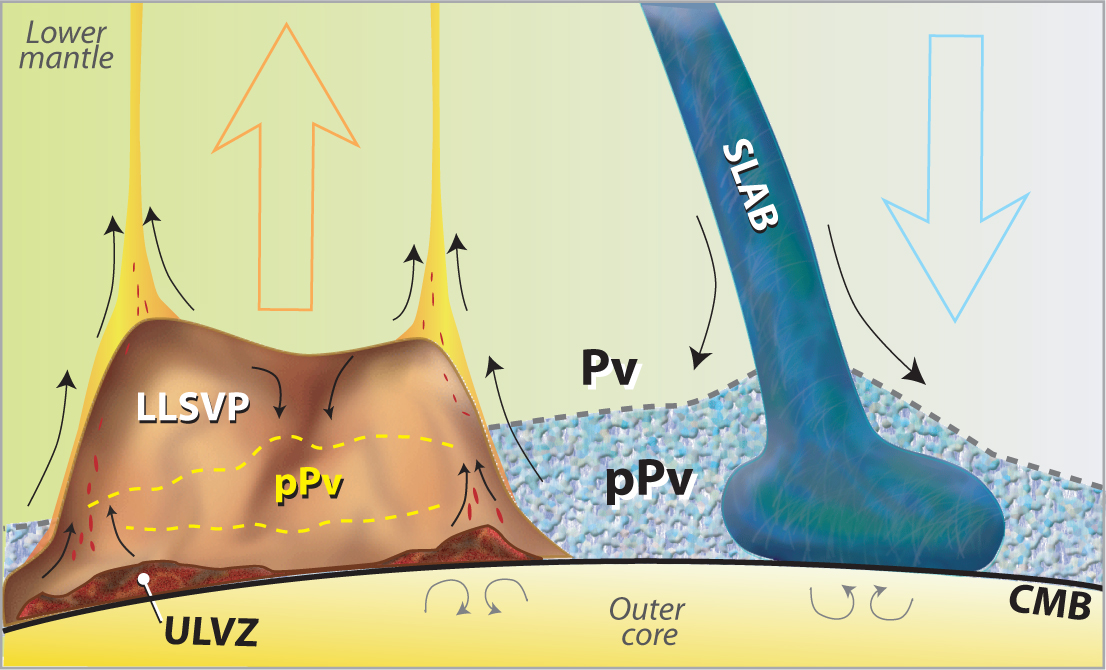
This image is a busy one, but summarizes many of the recent findings of the deep interior: from Dense Thermo-Chemical Piles (DTCP) to Slabs to Ultra-Low Velocity Zones (ULVZ) [PDF]
|
The possibility of dense thermo-chemical piles at the bottom of Earth's mantle relates to a number of things, including geographical locations of plume roots, and probable locations for ULVZ [PDF]
|
This figure is a bit out-dated, but I still see it getting used, so I'm leaving it up. It emphasizes at least in this cross-section that high shear wave speeds are seen from the surface to the CMB, suggesting deep mantle slab penetration.
|
Yes, this image is a bit over the top, but who knows? This is supposed to dramatically depict a chemical pile sitting on the core, w/ plumes coming off, a post-perovskite layer within (blue), and even a skinny ULVZ (pink) [PDF]
|
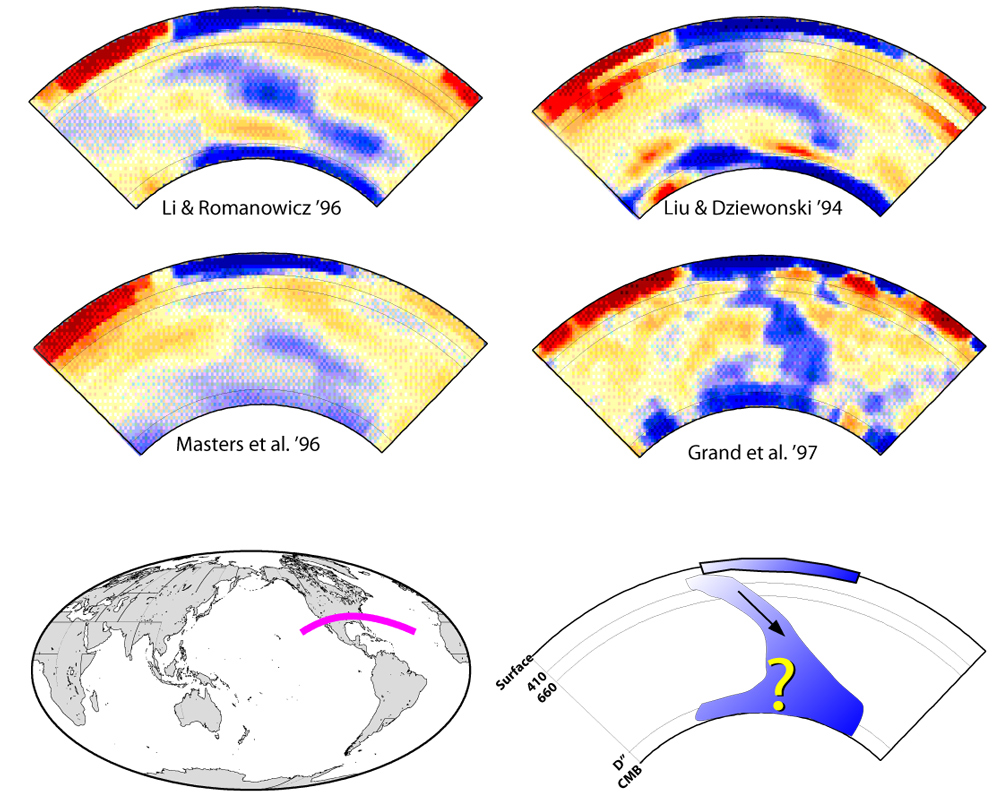
Nick Schmerr used 10's of 1000's of SS precursors to map the relief on the 410 and 660 km deep phase boundaries (purple=deepened, white=elevated). We used these patterns to argue for water in the mantle. [PDF]
|
|
Some plots showing various interpretations or depictions of Earth's interior (return to image directory page)
|
||||
 |
 |
 |
 |
 |
| AI (9.2 Mb) JPG (180 Kb) | AI (639 Kb) JPG (377 Kb) | PSD (132 Mb) JPG (576 Kb) | AI (347 Kb) JPG (313 Kb) | AI (388 Mb) JPG (305 Kb) |
|
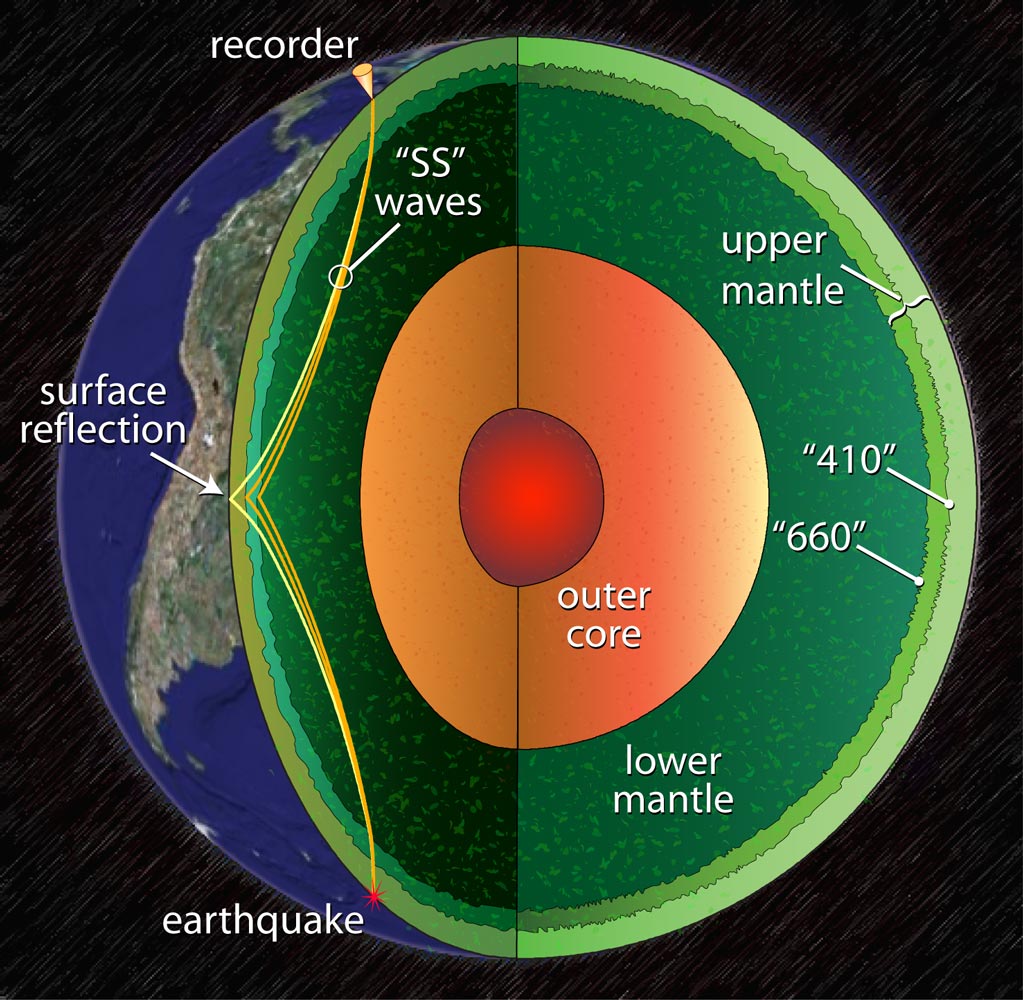
This is a simple image of Earth's interior, showing the paths of SS waves and their precursors (for Nick Schmerr's work). These are the type of data used to make that previous image [PDF]
|
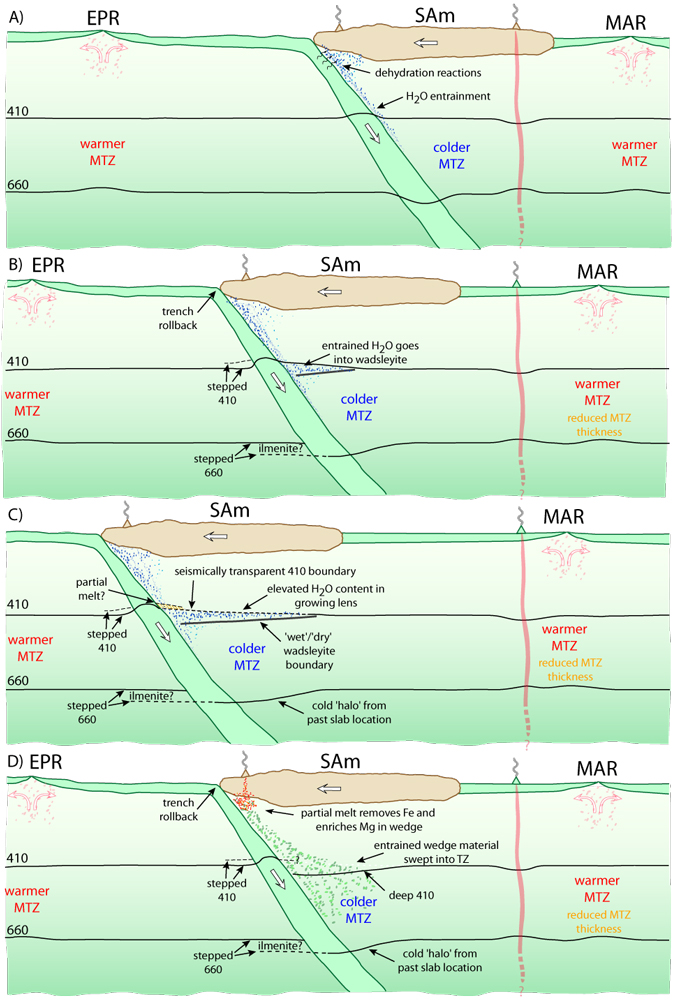
A number of possibilities exist for causing a phase transition to occur at a shallower or deeper depth. This image shows two possibilities: Iron or water content, from Nick's paper again [PDF]
|
Seismic ray paths are shown going through a big red blob! But seriously... The blue and red features are high and low velocity material, from tomography. Allen McNamara and I were trying to get the cover image (unsuccessful, I might add!) [PDF]
|
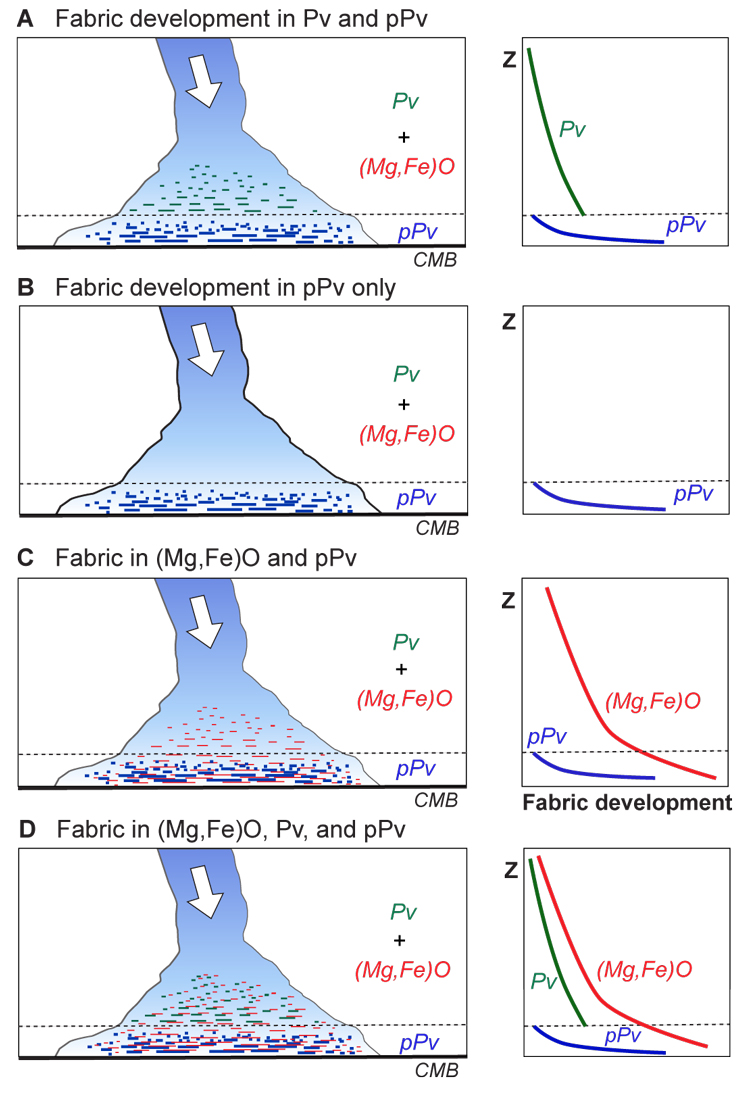
Beneath downwelling material, many interesting possibilities exist for building up strain that might manifest as seismic anisotropy, especially in the vicinity of a phase transition. [PDF]
|
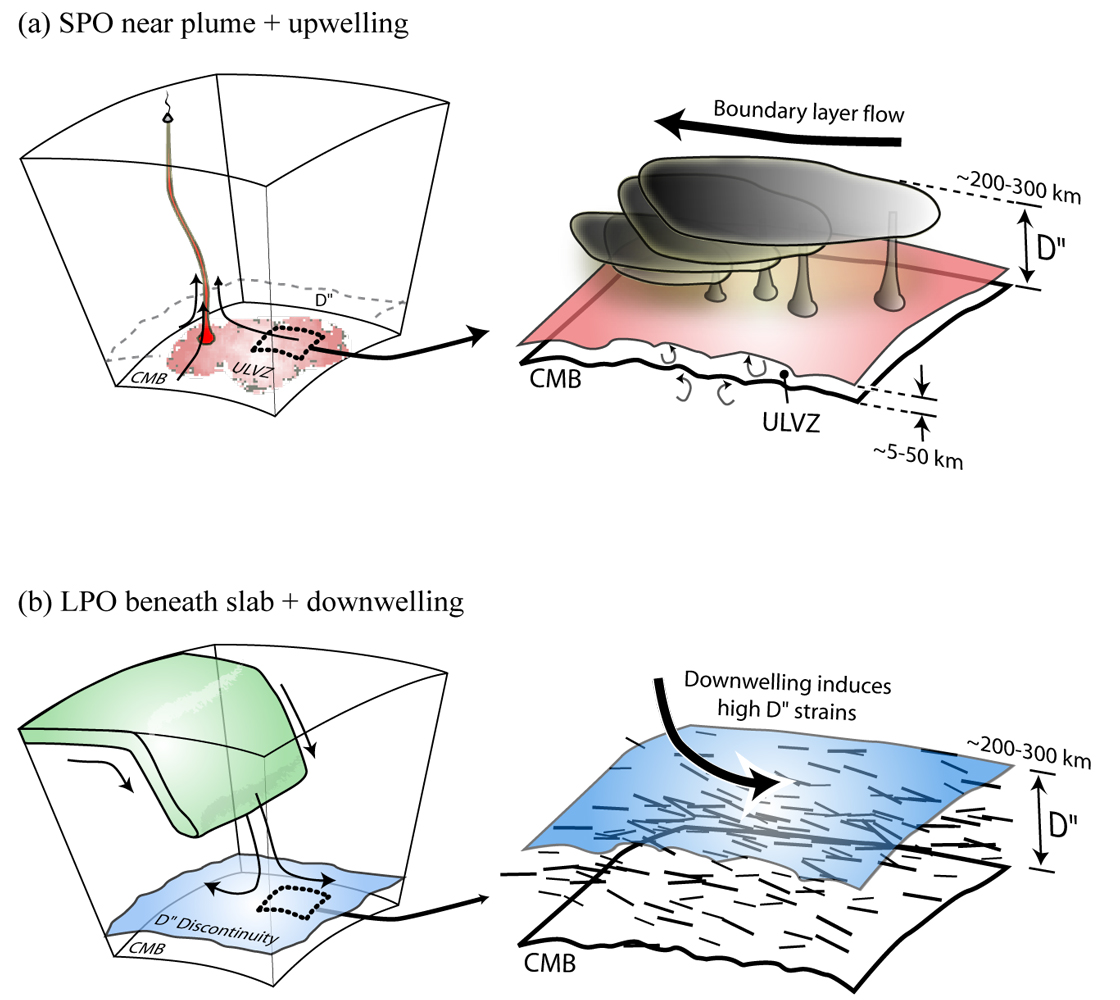
There are several possible causes for seismic anisotropy in the deep mantle. Here, Melissa Moore depicts shape and lattice preferred orientation (SPO and LPO, respectively) [PDF]
|
|
Some plots showing various interpretations or depictions of Earth's interior (return to image directory page)
|
||||
 |
 |
 |
 |
 |
| AI (1.3 Mb) JPG (180 Kb) | AI (1.2 Mb) JPG (391 Kb) | AI (204 Kb) JPG (219 Kb) | AI (1.4 Mb) JPG (219 Kb) | AI (170 Mb) JPG (195 Kb) |
|
This is a "we've come a long way" cartoon. In just over a hundred years, our understanding of the mantle has going from homogeneous mantle plus core, to just about anything you might imagine!
|
This image is not different from previous ones, just perhaps more colorful. It shows the dominant features that may exist in the deep mantle.
|
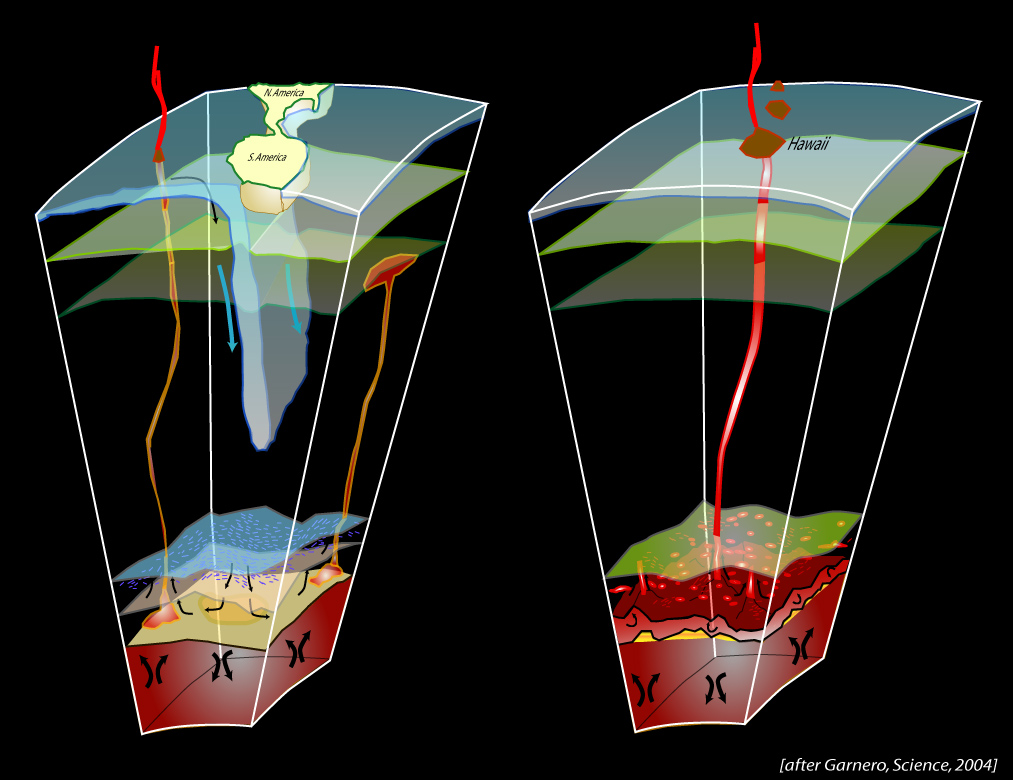
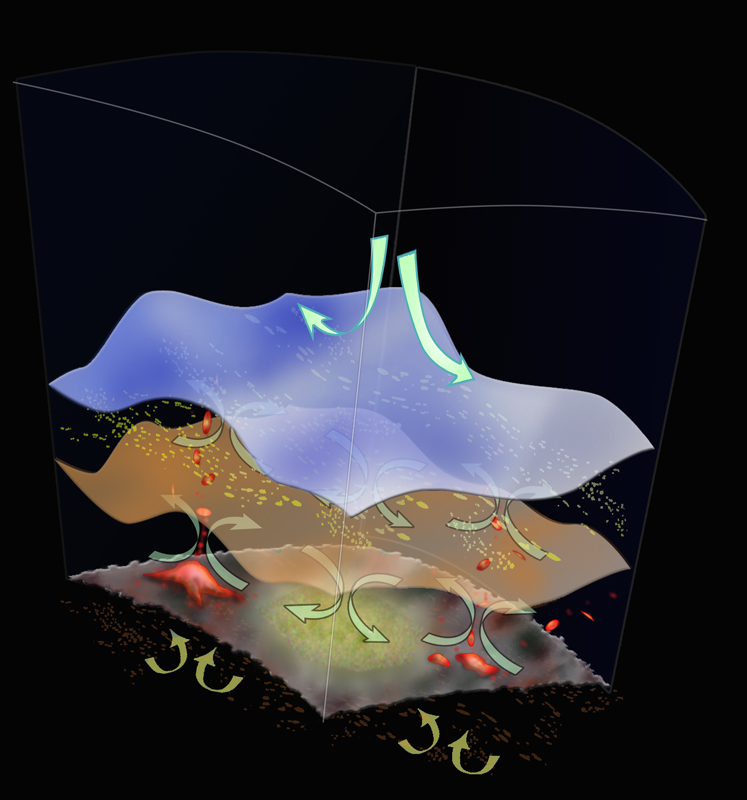
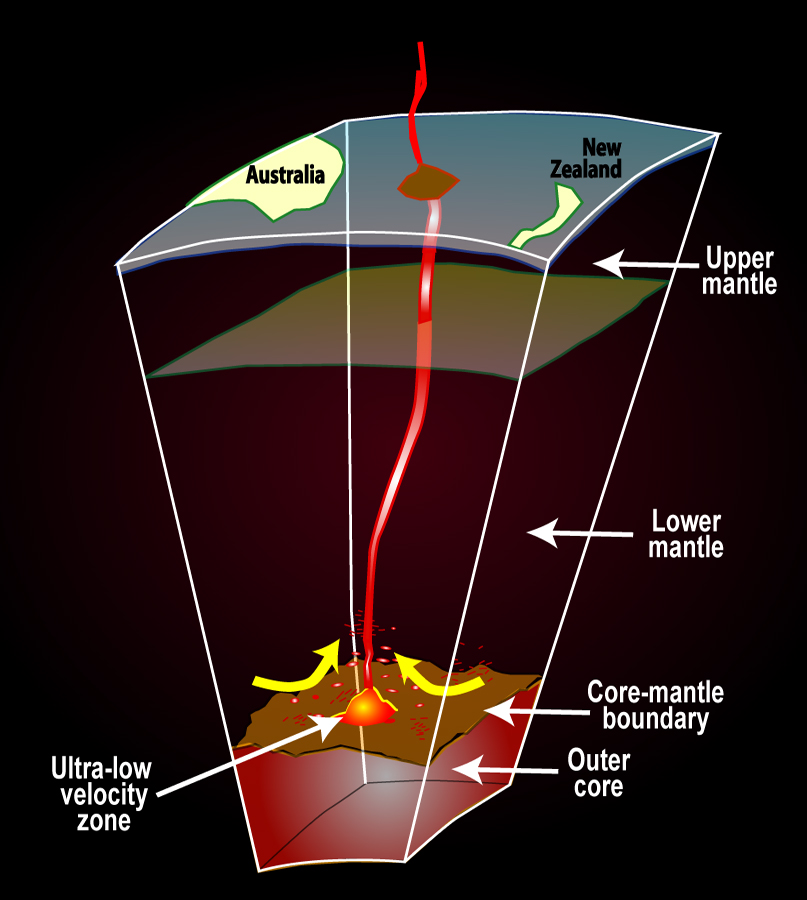
This image was drawn to suggest that partially molten ultra-low velocity zones at the CMB might give rise to plumes that feed hot spot volcanos (though keep in mind: this is just a cartoon). [PDF]
|
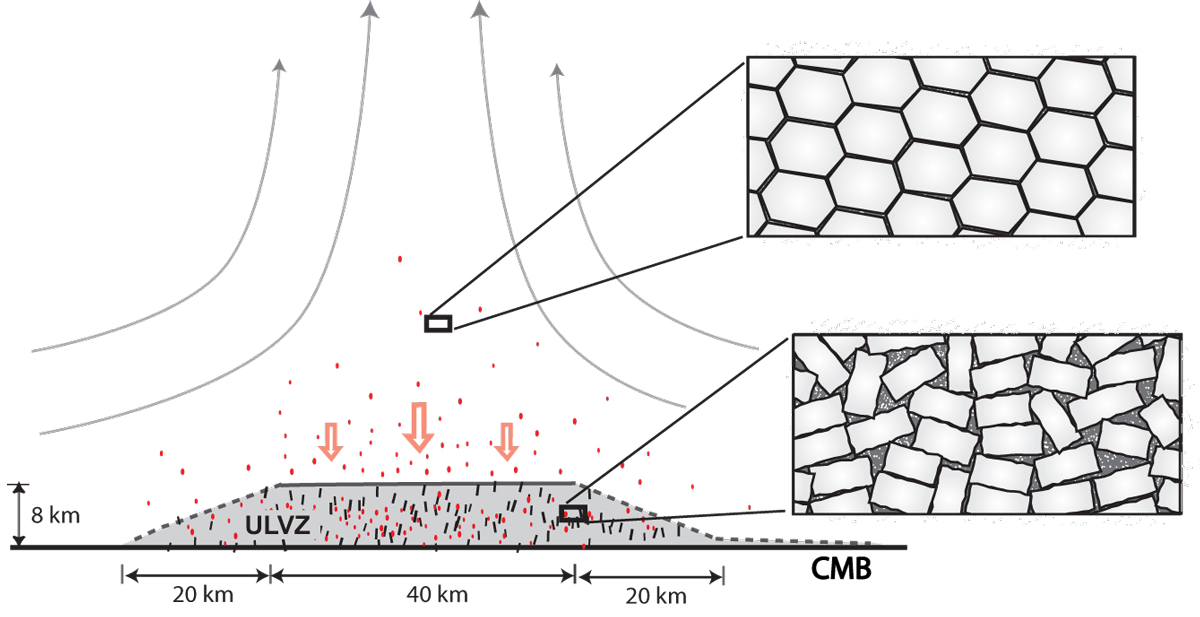
If an ultra-low velocity zone is partially molten, how might a reasonable (observable) thickness be maintained? Here we hypothesize a scenario involving interlocking crystals beneath a plume. [PDF]
|
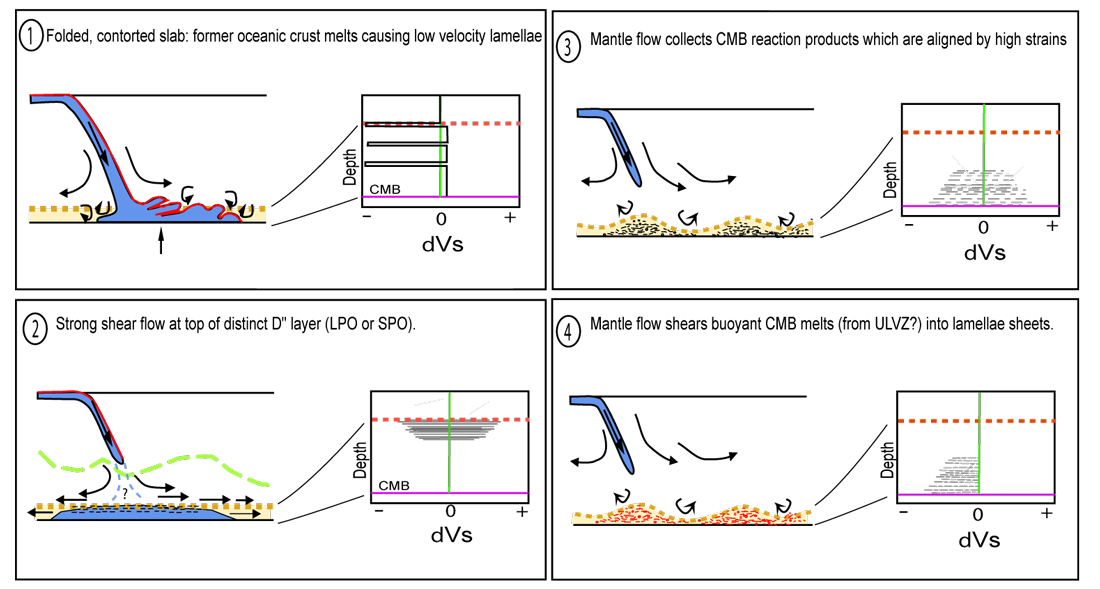
A number of possibilities exist that might give rise to anisotropy in the lowermost mantle beneath subduction. Here are a few than involve heterogeneities, melt, and high strains [PDF]
|