
Some seismic data images, and more!
|
Some plots showing seismic data used to probe the Earth's interior (return to image directory page)
|
||||
 |
 |
 |
 |
 |
| AI (736 Kb) JPG (225 Kb) | AI (488 Kb) JPG (157 Kb) | AI (488 Kb) JPG (157 Kb) | AI (542 Kb) JPG (283 Kb) | AI (337 Kb) JPG (280 Kb) |
|
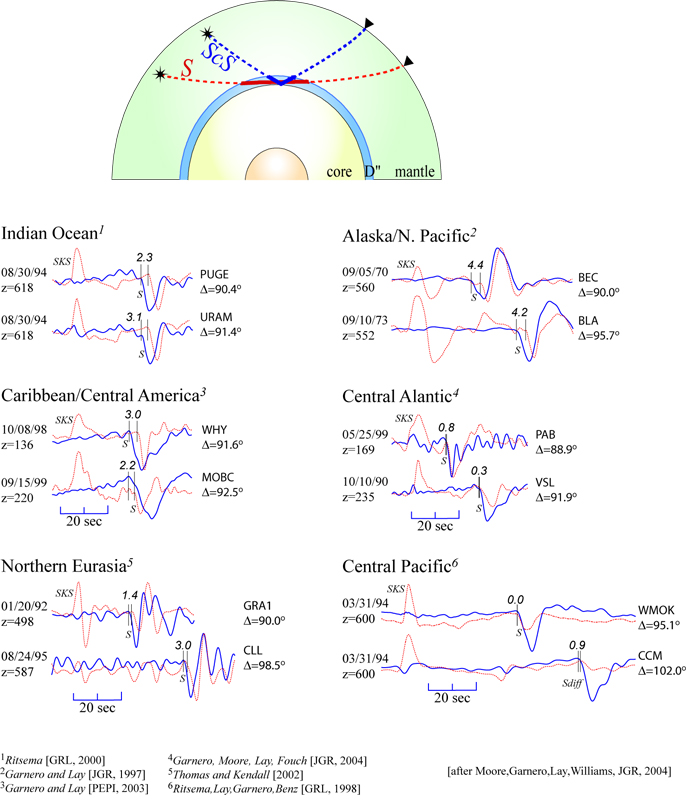
SH (blue) and SV (red) components of ScS and S or Sdiff are used to study seismic anisotropy in the deep mantle. If the data are abundant and clean, this permits interpretation of deep mantle convection currents. [PDF]
|
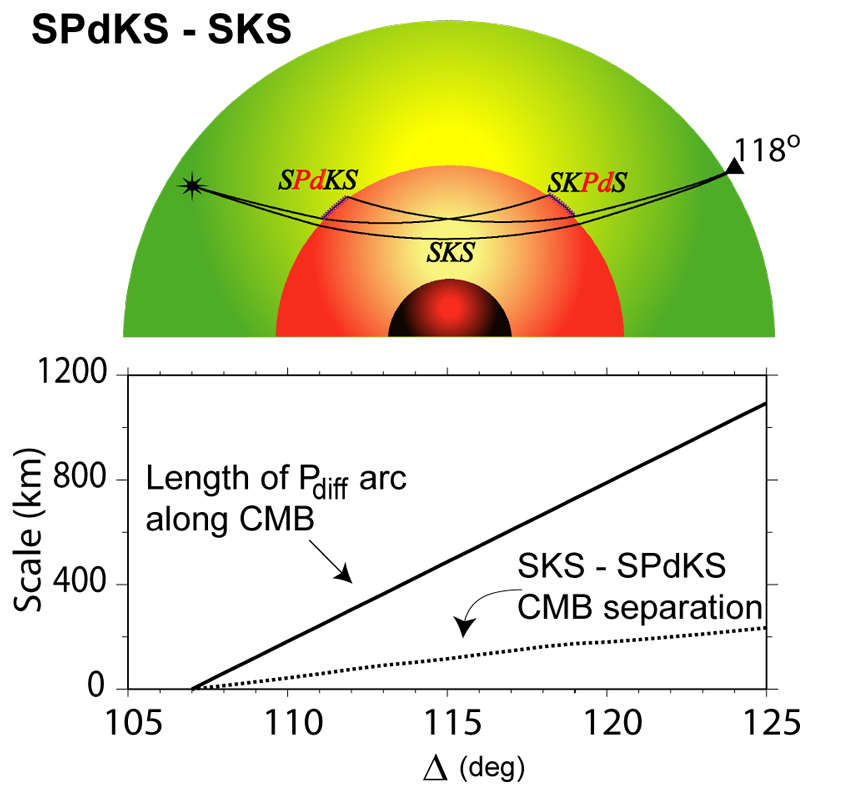
Differential analyses between ScS and S, as well as S(or Sdiff) and SKS, yield valuable information on deep mantle heterogeneity and anisotropy. These waves are used in forward and inverse modeling. [PDF]
|
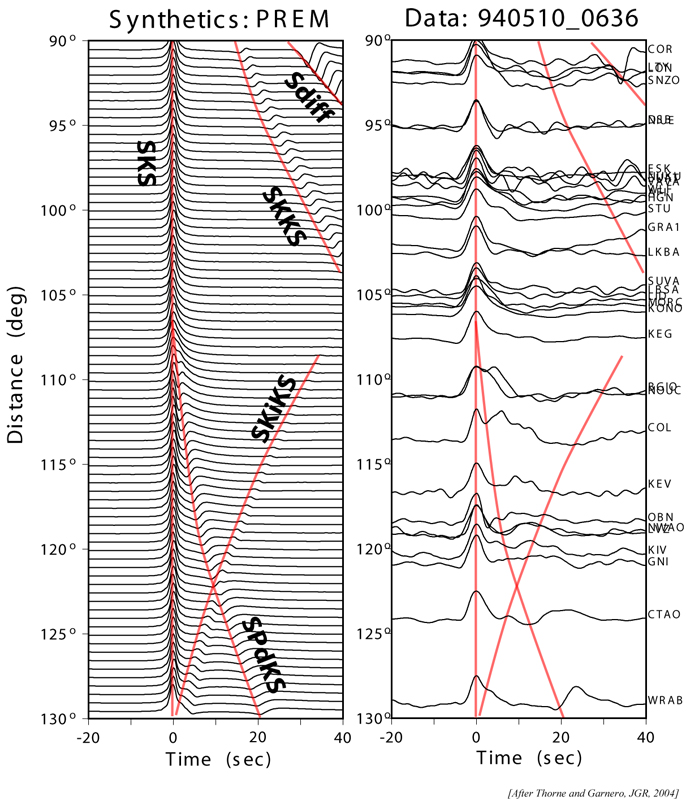
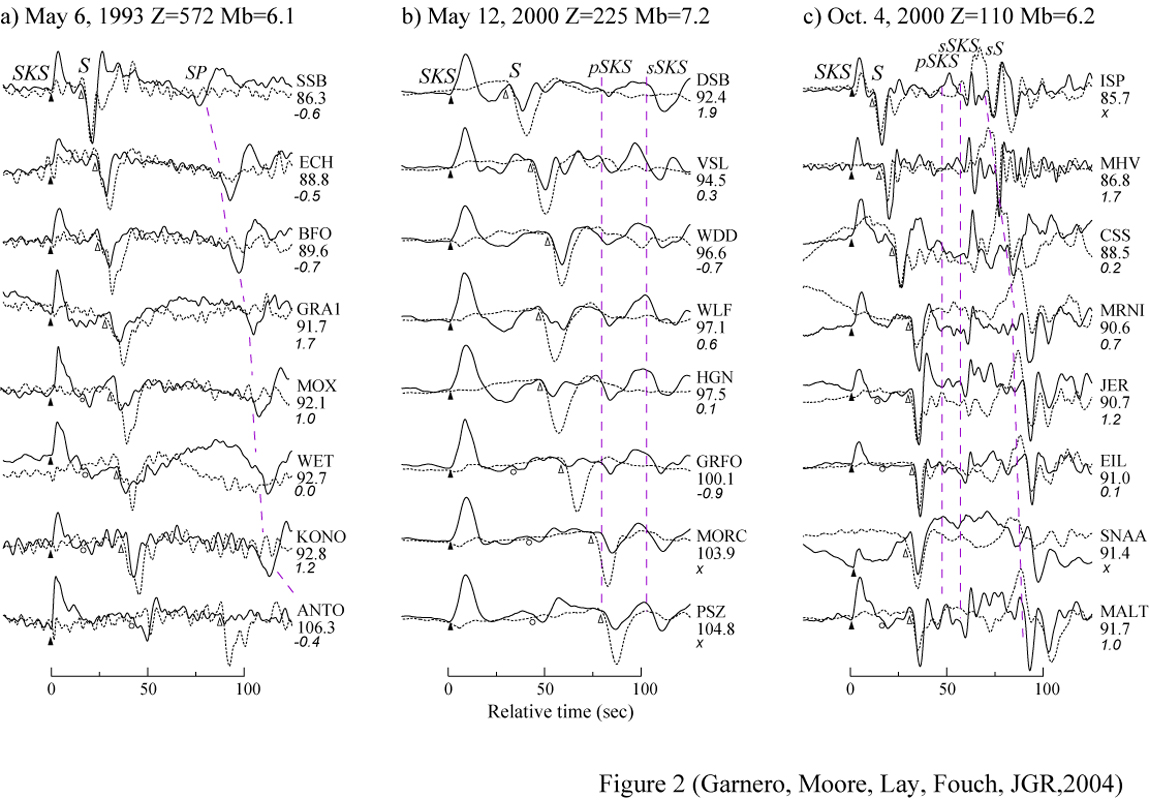
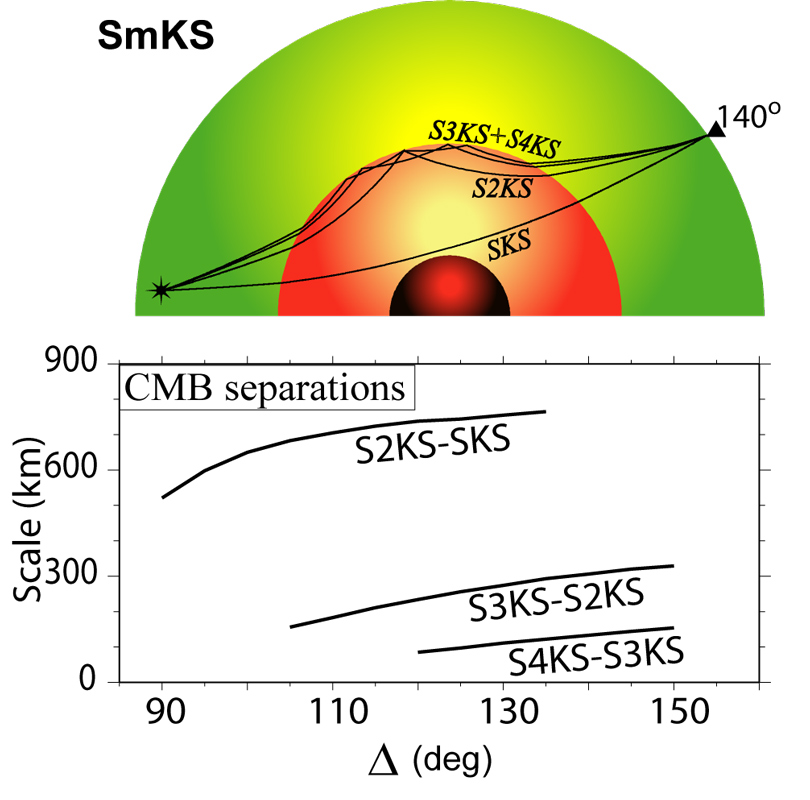
A variety of important seismic arrivals are present on the SV component of motion in the distance range from 90 to 130 degrees. Here they are compared to synthetic seismogram predictions on the left. [PDF]
|
||
|
Some plots showing seismic data used to probe the Earth's interior (return to image directory page)
|
||||
 |
 |
 |
 |
 |
| AI (414 Kb) JPG (214 Kb) | AI (647 Kb) JPG (148 Kb) | AI (674 Kb) JPG (419 Kb) | AI (2.4 Mb) JPG (218 Kb) | AI (748 Kb) JPG (333 Kb) |
|
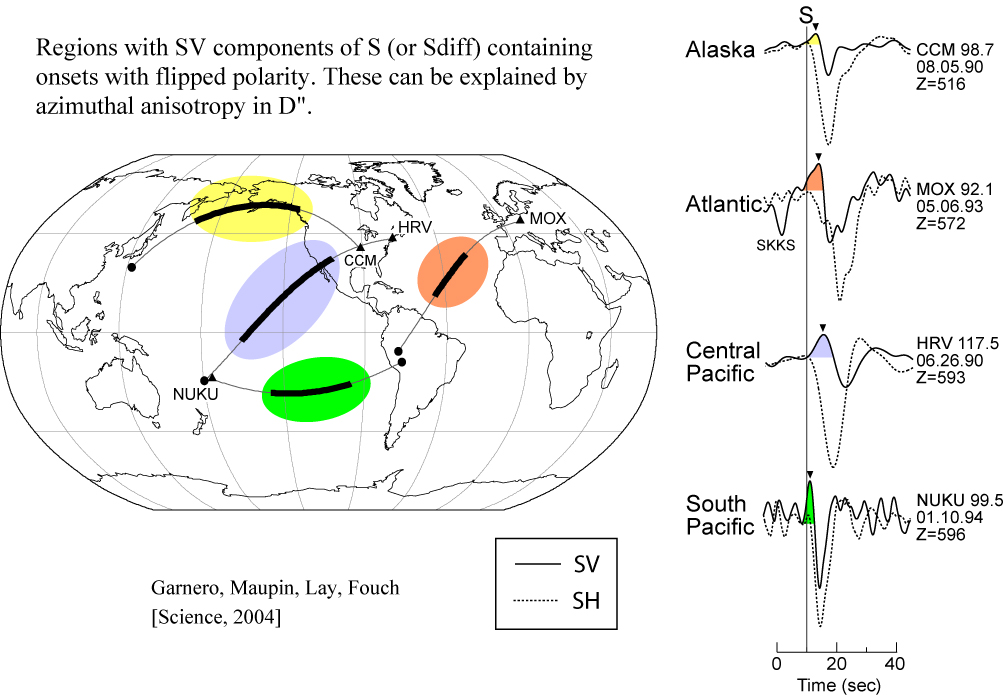
Azimuthal anisotropy in D" can give rise to coupling between the SH and SV components of the S wave. Here we present several regions that show such behavior. [PDF]
|
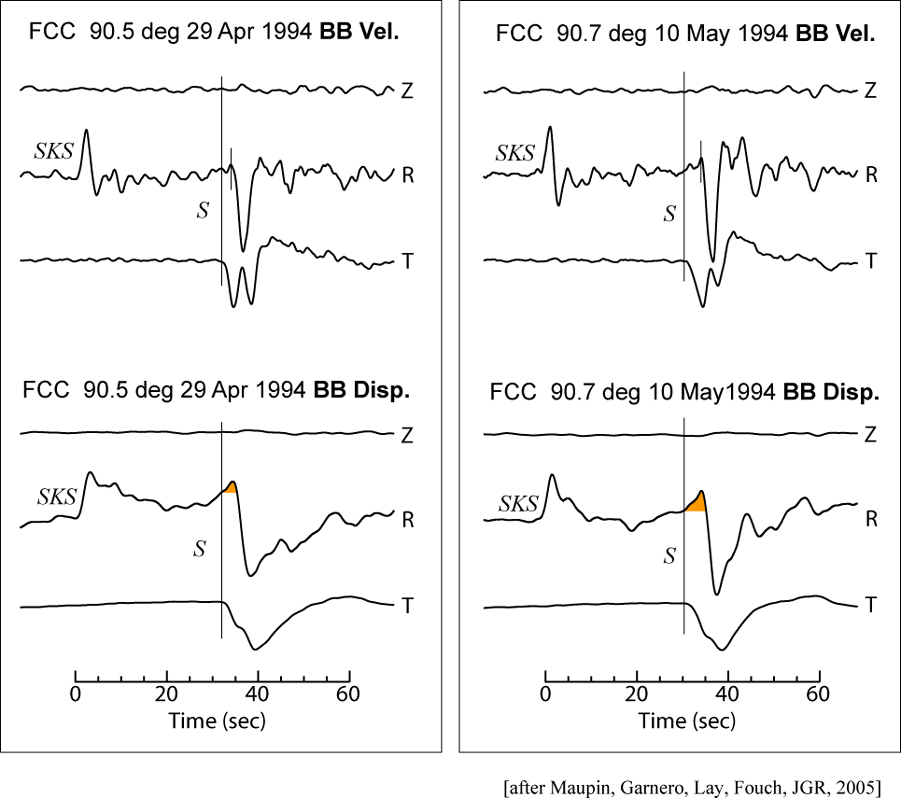
Station FCC of the Canadian network is shown, both in velocity (top panels) and displacement (bottom) panels. The SV precursory pulse is easily visible in the latter. [PDF]
|
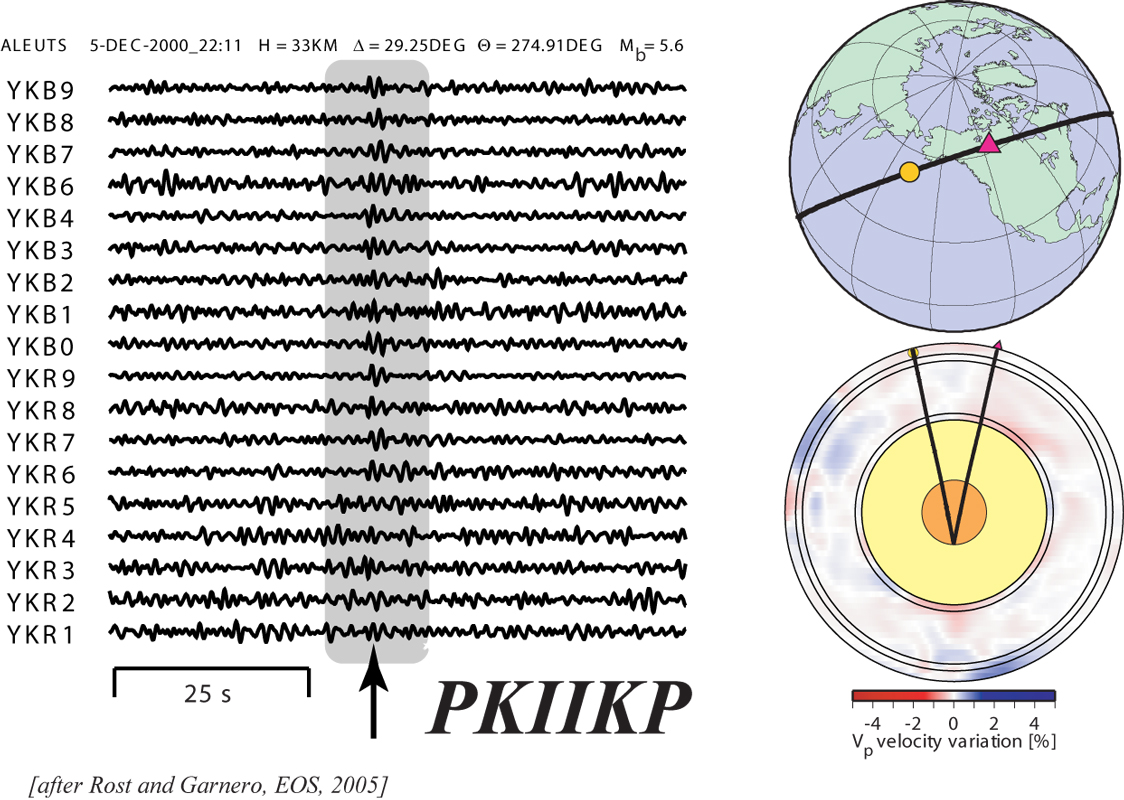
Array analyses of seismic data permit the sometimes observability of very faint seismic waves, like PKIIKP, which reflects from the inside of the inner core. [PDF]
|
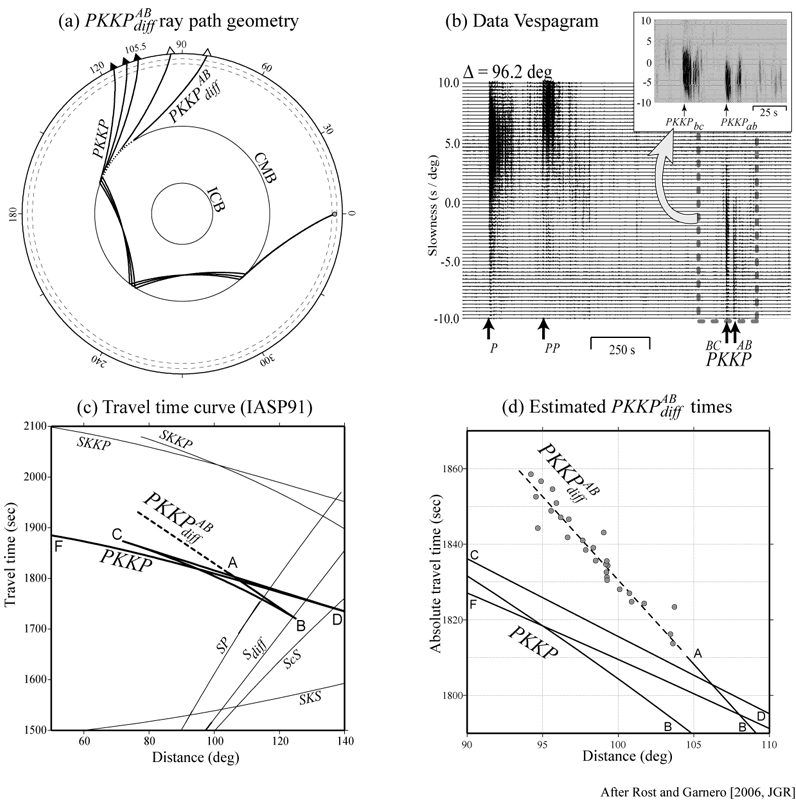
Again, using seismic arrays, a wave reflected from the underside of the CMB is seen as it diffracts at the CMB, called PKKPab_diff. This wave can be used to study ULVZ structure.
|
For decades, S waves referenced to SKS have been useful for mapping both deep mantle heterogeneity and anisotropy. Here, shear wave splitting is investigated. [PDF]
|
|
Some plots showing seismic data used to probe the Earth's interior (return to image directory page)
|
||||
 |
 |
 |
 |
 |
| AI (403 Kb) JPG (212 Kb) | AI (330 Kb) JPG (299 Kb) | AI (1.1 Mb) JPG (547 Kb) | AI (273 Kb) JPG (93 Kb) | AI (260 Kb) JPG (152 Kb) |
|
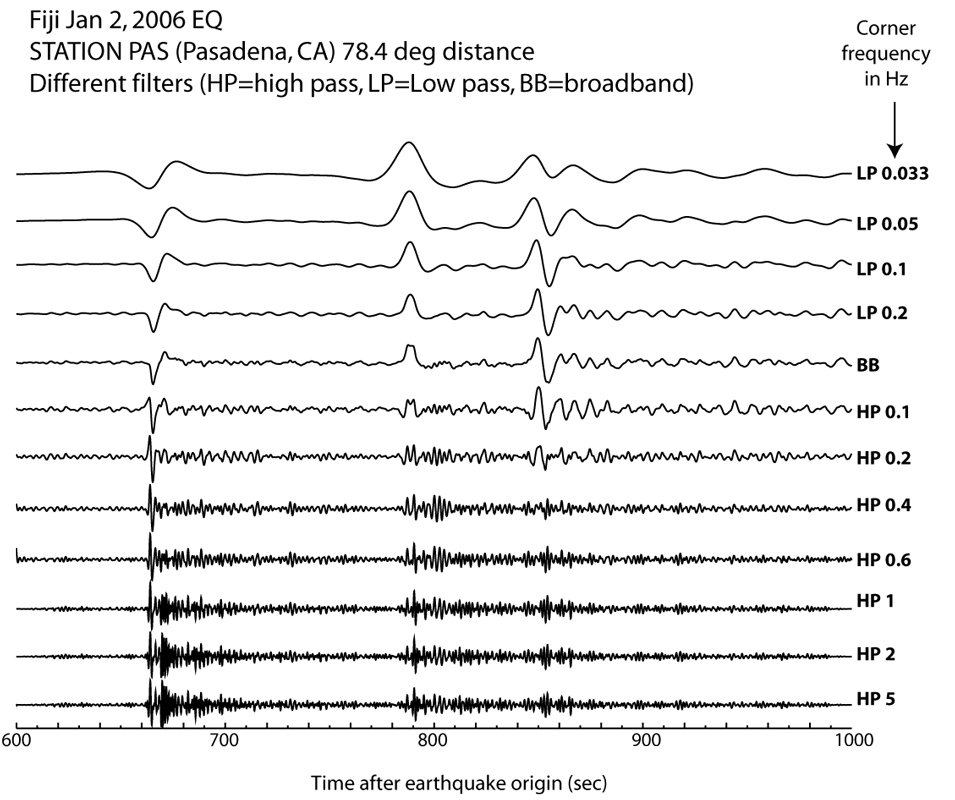
Here we see a vertical component seismogram from Pasadena CA of a deep Fiji earthquake filtered different ways. The three arrivals are P, pP, and sS.
|
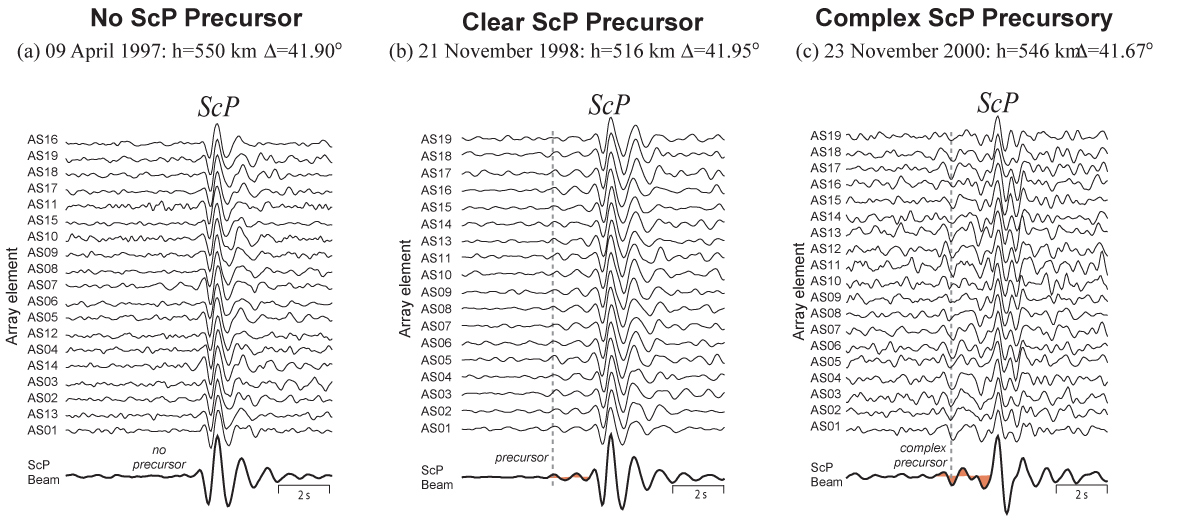
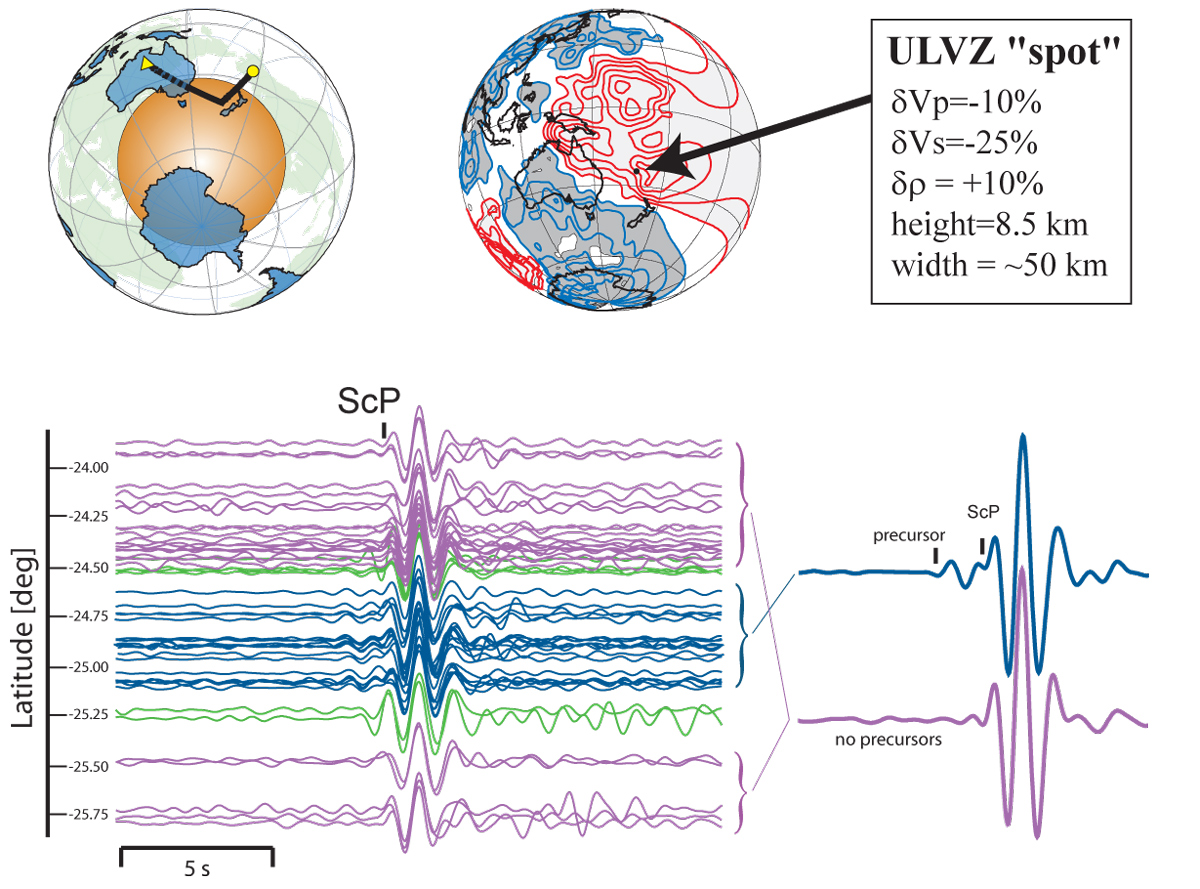
Here is another example of ScP array recordings, this time at the Warramunga (WRA) array, in Australia. These data argue for a very localized ULVZ that is partial melt in origin. [PDF]
|
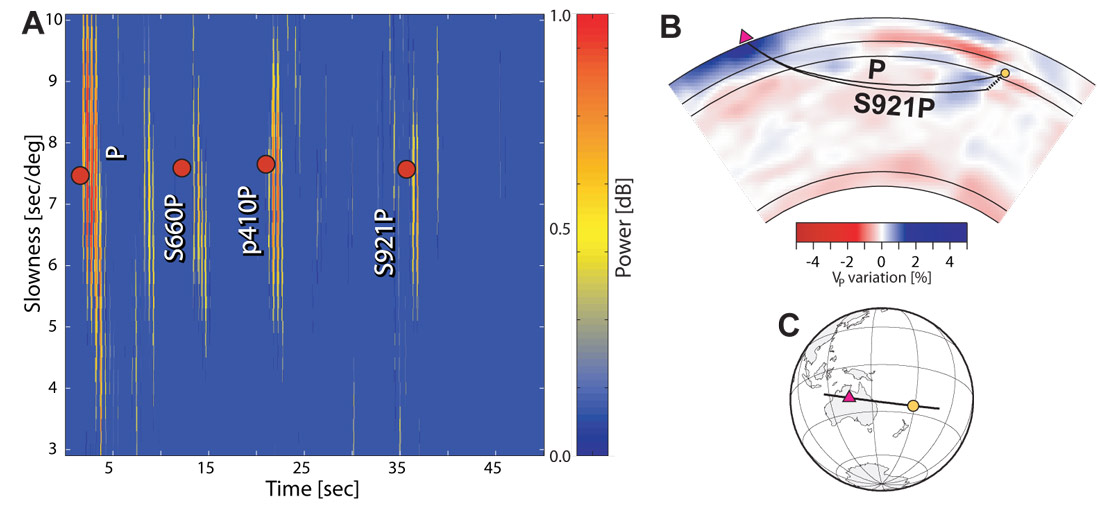
Array analyses permit detection of otherwise difficult to detect energy. Here, we see an S wave converted to a P-wave some 900+ km into the mantle. The figure on the left is a "vespagram". "Slowness" equates to arrival angle. [PDF]
|
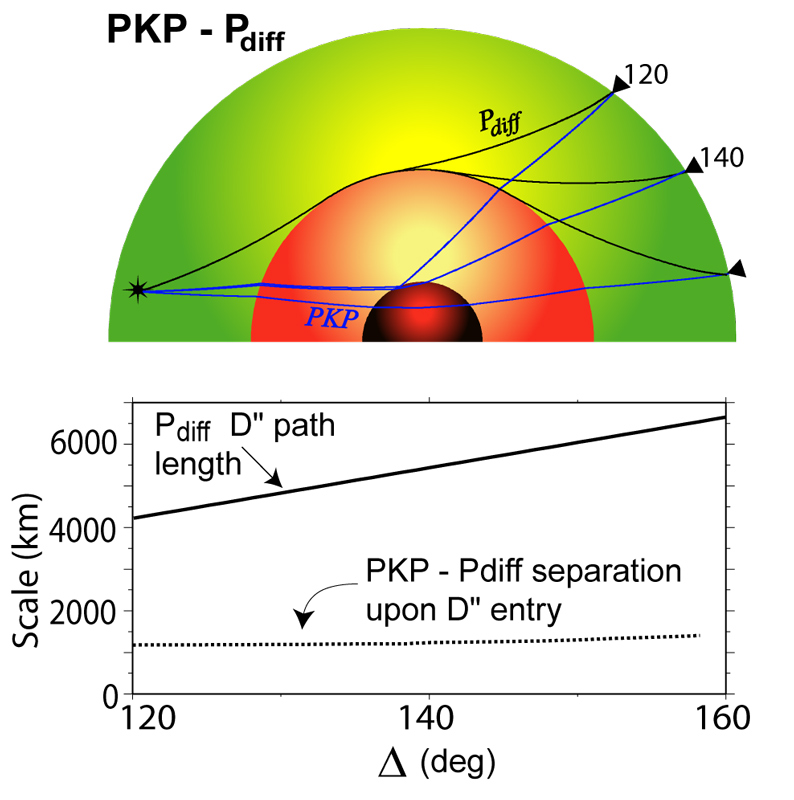
PKP is a seismic P-wave that penetrations deep into the core of the Earth. It is often referenced to a diffracted P-wave (Pdiff). This image shows some physical scale aspects of the pair of waves. [PDF]
|
|
|
Some plots showing seismic data used to probe the Earth's interior (return to image directory page)
|
||||
 |
 |
 |
 |
 |
| AI (231 Kb) JPG (158 Kb) | AI (234 Kb) JPG (158 Kb) | AI (243 Kb) JPG (160 Kb) | AI (259 Kb) JPG (152 Kb) | AI (225 Kb) JPG (126 Kb) |
|
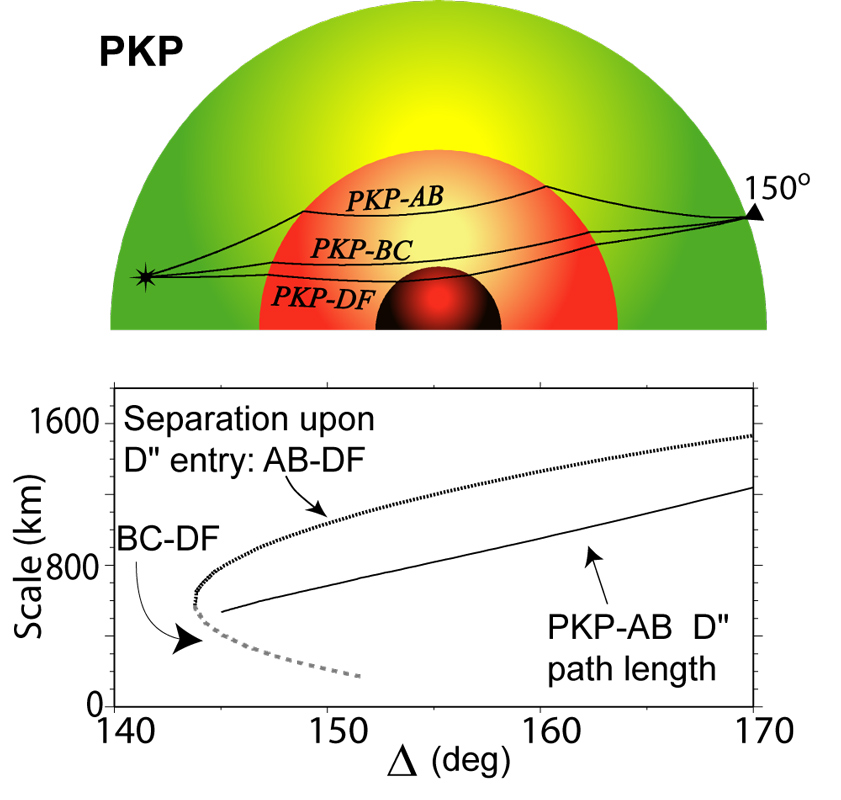
The three common "branches" of PKP are shown here, along with some of their physical scales. the BC and DF branches are often used together to study the outermost inner core. [PDF]
|
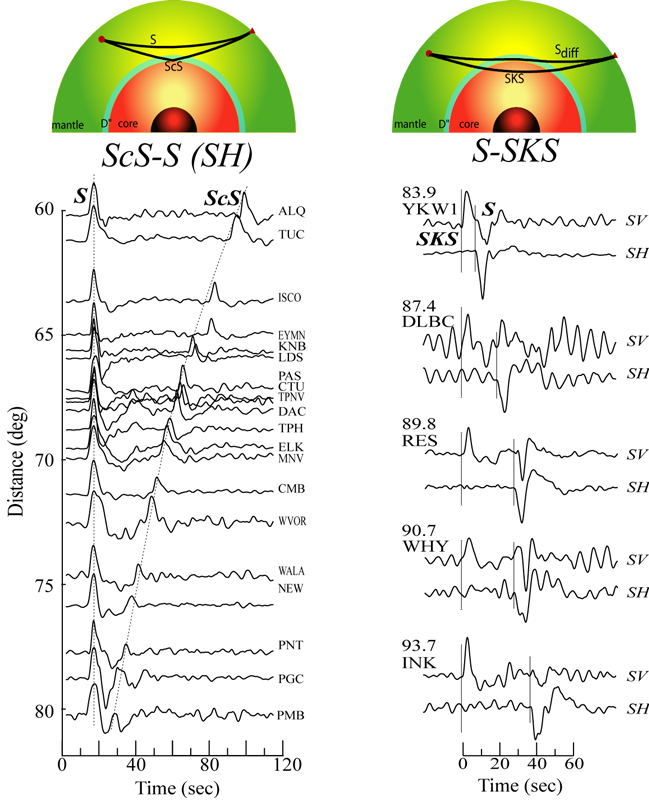
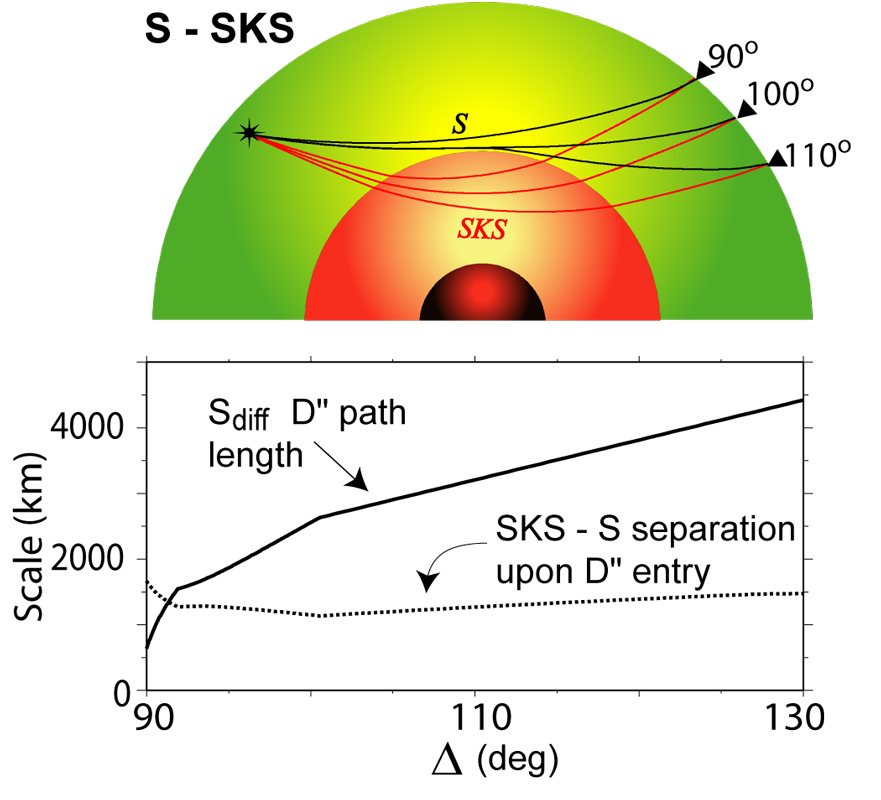
S and SKS were my bread and butter as a graduate student. SKS is used as a reference wave to study S (or diffracted S), which tells us about the deepest mantle. [PDF]
|
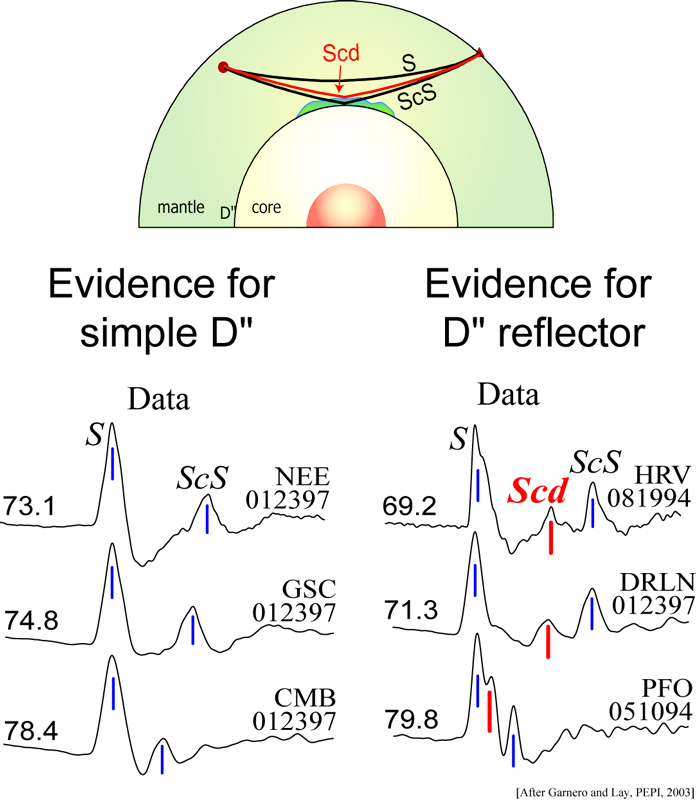
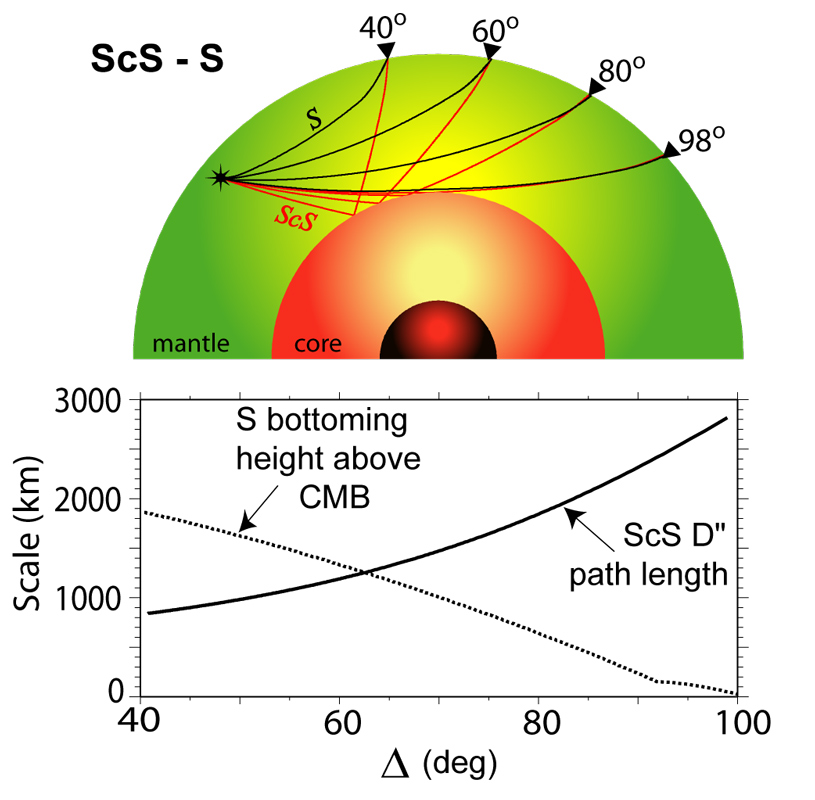
S and ScS are used much in the same way S and SKS are used, except S is the reference, and ScS becomes the probe. My group with the group of Thorne Lay use this probe a lot these days. ScS is usually a strong arrival. [PDF]
|
The core mantle boundary is a great reflector of energy from the top, or from underneath. Here, we see underside reflections:, SKKS, SKKKS, SKKKKS, etc. These are great for studying the outer core. [PDF]
|
PKP is a seismic P-wave that penetrations deep into the core of the Earth. It is often referenced to a diffracted P-wave (Pdiff). This image shows some physical scale aspects of the pair of waves. [PDF]
|
|
Some plots showing seismic data used to probe the Earth's interior (return to image directory page)
|
||||
 |
 |
 |
 |
 |
| AI (1.2 Mb) JPG (554 Kb) | AI (1.2 Mb) JPG (529 Kb) | AI (1.8 Mb) JPG (587 Kb) | AI (893Kb) JPG (321 Kb) | AI (538 Kb) JPG (83 Kb) |
|
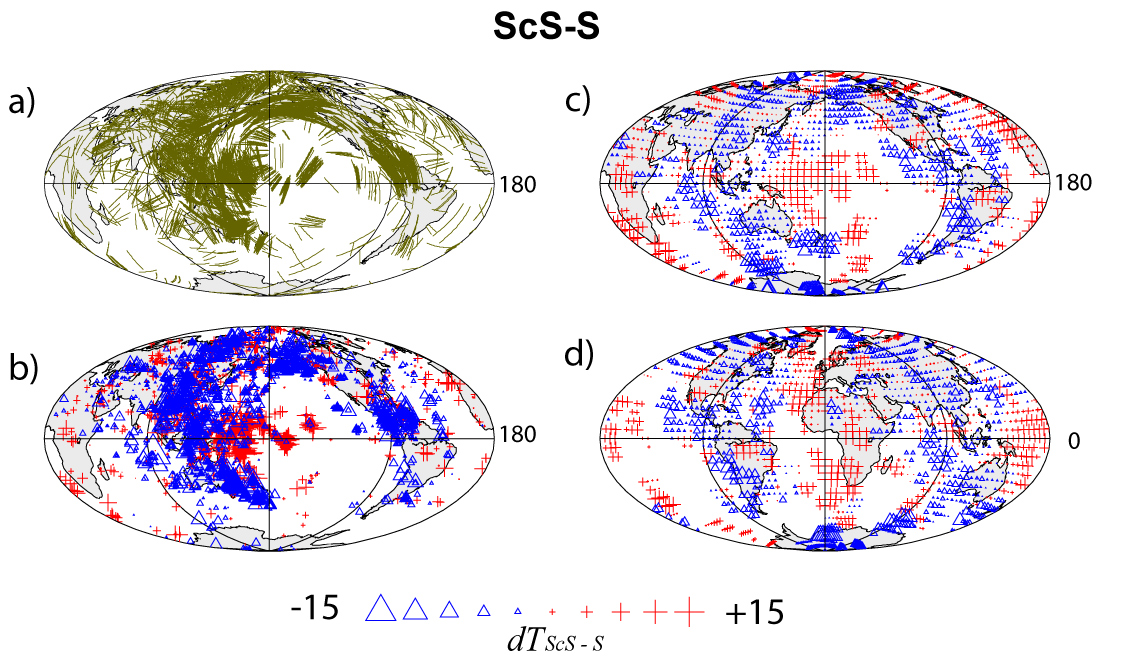
Here we see ScS-S travel time anomalies displayed along the D" portion of the ScS path (raw time anomalies on the left, and smoothed on the right). More info: PDF
|
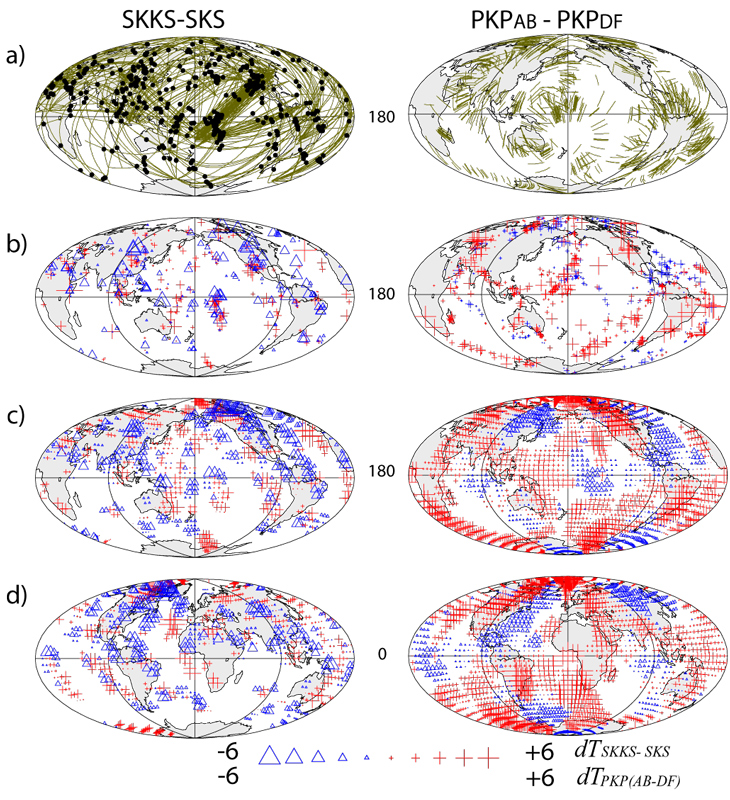
SKKS-SKS and PKPab-PKPdf differential time anomalies are shown, which are sensitive to seismic wave anomalies in the deepest mantle. More info: PDF
|
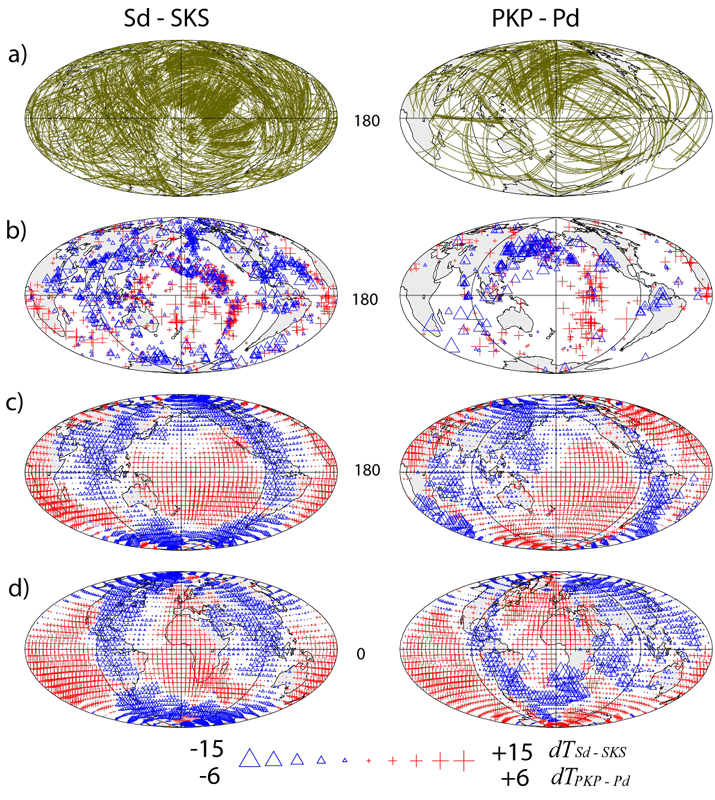
Sdiff-SKS and Pdiff-PKP times are shown. It is pretty cool: in the smoothed times (bottom panels), you see the characteristic "ring around the Pacific". More info: PDF
|
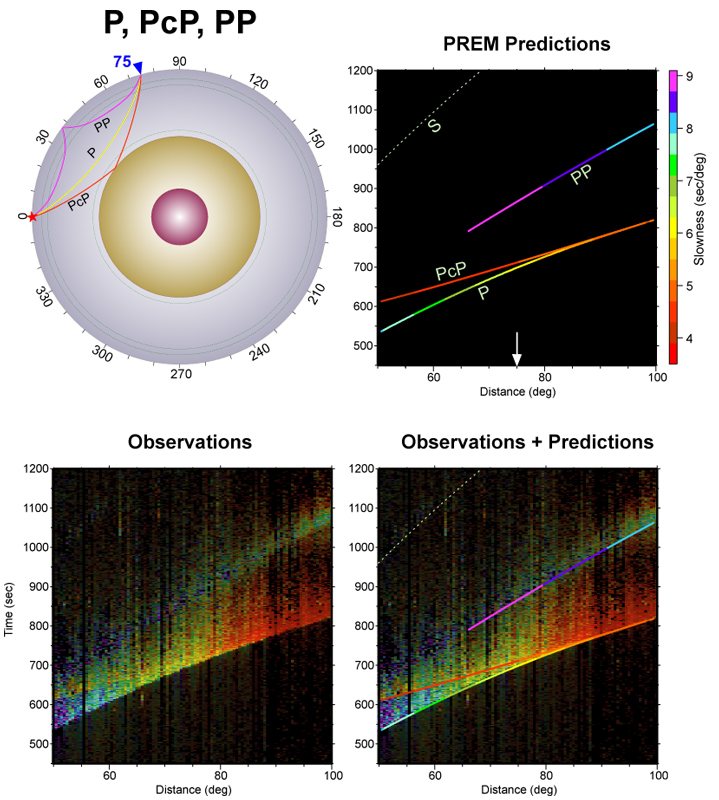
This sweet of figures is from an SRL note w/ Mike Thorne and Sebastian Rost. The show the power of the information in array recordings, here, P, PcP, PP. Read the paper at PDF
|
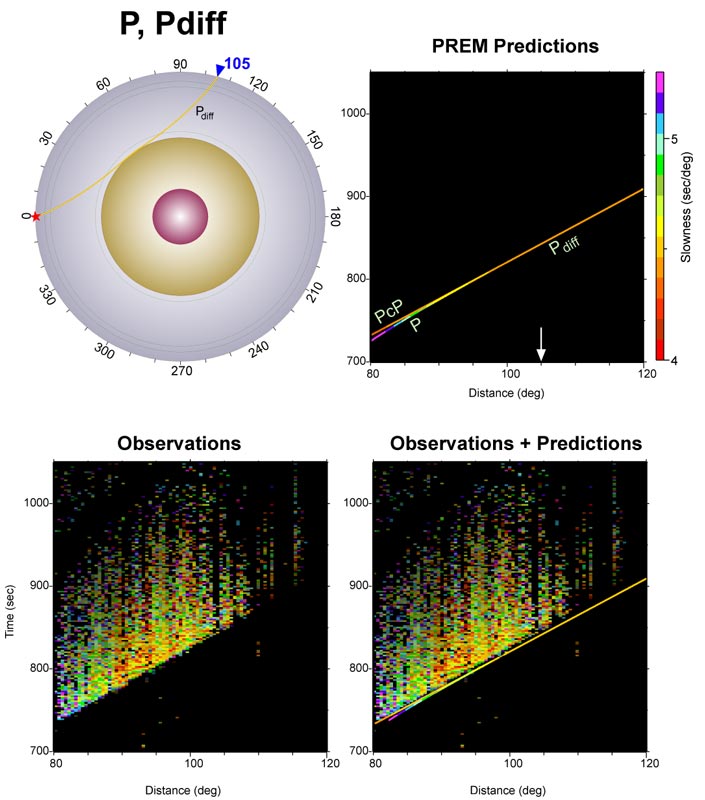
P and Pdiff are shown. Note the intense coda energy to the Pdiff, which is probably due to scattering in D". PDF
|
|
Some plots showing seismic data used to probe the Earth's interior (return to image directory page)
|
||||
 |
 |
 |
 |
|
| AI (542 Kb) JPG (225 Kb) | AI (619 Kb) JPG (264 Kb) | AI (709 Kb) JPG (302 Kb) | AI (503Kb) JPG (265 Kb) | |
|
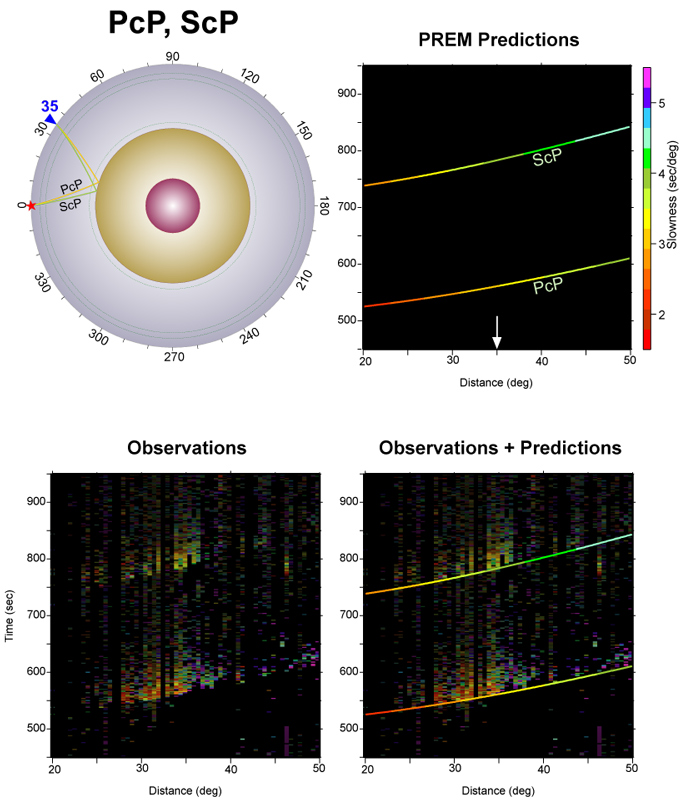
Here, the PcP and ScP wave fields are shown. Not quite as robust as some of the other panels. But we regularly use these waves to study the deep Earth. PDF
|
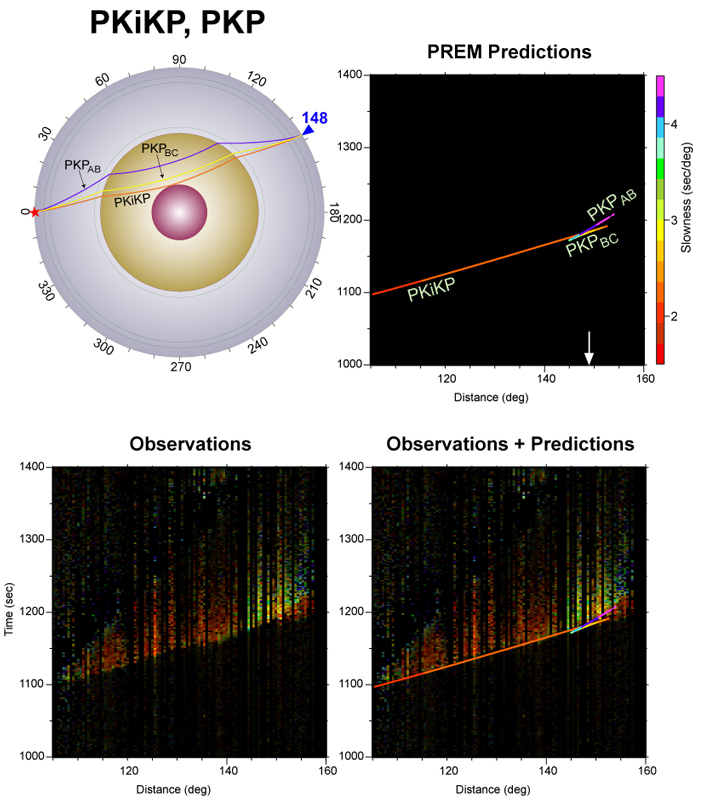
PKiKP is great for looking at the inner core, and the boundary between the inner and outer core. Here we show it transitioning into the PKP triplication. PDF
|
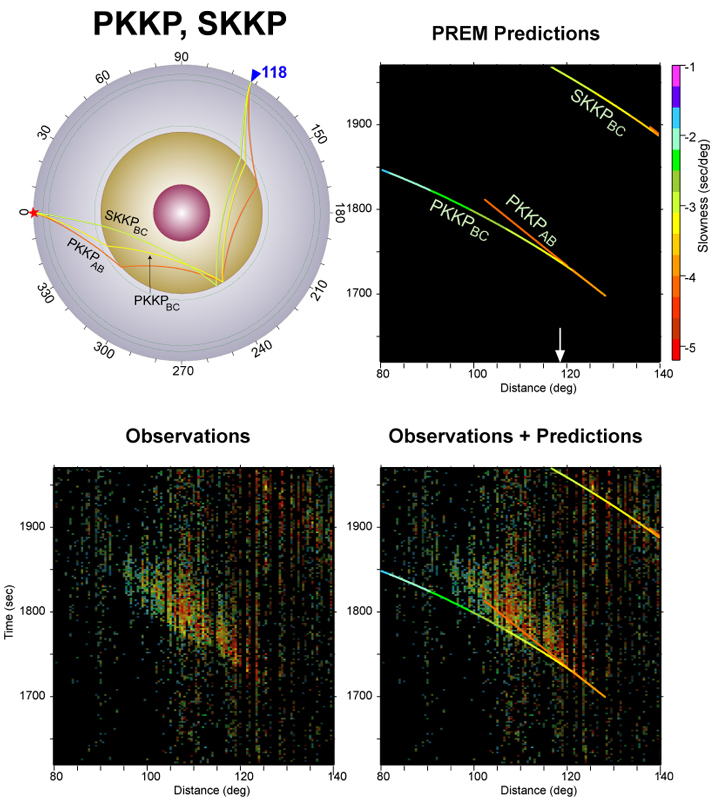
PKKP and SKKP are shown here. These are less commonly studied, but certainly are important for deep Earth study. PDF
|
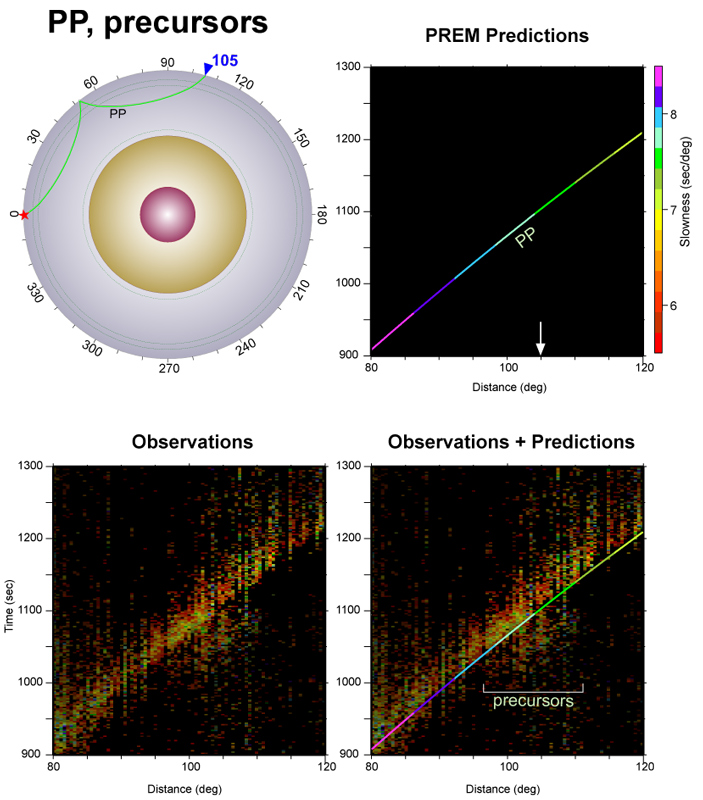
The wave PP is shown, along with precursors between 100 and 110 degrees. We used these to study slabs in the lower mantle in this paper: PDF
|
|